I use the Williams Fractal
https://usethinkscript.com/threads/bill-williams-fractal-indicator-for-thinkorswim.600/
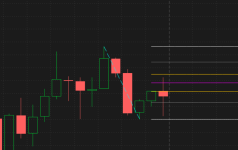
to make entries when the price crosses above the upfractal or below the downfractal. I need a way to create a horizontal line from the plotted indicator upfractal that stays visible until the next upfractal is plotted. Same for the downside. This is the code I'm using to start with:
# Bill Williams fractal indicator
# written by Mike Lapping
#
# Make sure that you change the settings for this indicator so that it plots arrows
# up for upfractal plots
# down for downfractal plots
#
# can be used and modified by anyone for any reason. do not sell.
declare upper;
def isupfractal;
def isdownfractal;
# Looking for high and low series of equalities
# checking for possible fractal formation
rec hicount = If (high == high[1], hicount[1] + 1, 0);
rec hivalid = If (
(hicount[1] == 0 and hicount == 1 and high > high[2] and high > high[3]) or
(hicount[1] and hicount and hivalid[1]) or
(hicount[2] and hivalid[2] and high == high[2] and high > high[1]), 1, 0);
rec locount = If (low == low[1], locount[1] + 1, 0);
rec lovalid = If (
(locount[1] == 0 and locount == 1 and low < low[2] and low < low[3]) or
(locount[1] and locount and lovalid[1]) or
(locount[2] and lovalid[2] and low == low[2] and low < low[1]), 1, 0);
# Checking for a traditional or non-standard up fractal
isupfractal = If(
((hicount and hivalid) or (high > high[1] and high > high[2])) and
high > high[-1] and high > high[-2], high, 0);
# Checking for a traditional or non-standard down fractal
isdownfractal = If(
((locount and lovalid) or (low < low[1] and low < low[2])) and
low < low[-1] and low < low[-2], low, 0);
plot upfractal = If(isupfractal, isupfractal + (1 * TickSize()), Double.NaN);
upfractal.SetPaintingStrategy(PaintingStrategy.TRIANGLES);
upfractal.SetLineWeight(5);
plot downfractal = If(isdownfractal, isdownfractal - (1 * TickSize()), Double.NaN);
downfractal.SetPaintingStrategy(PaintingStrategy.TRIANGLES);
downfractal.SetLineWeight(5);
Line code added to the bottom of your code
 Code:
Code:# Bill Williams fractal indicator # written by Mike Lapping # # Make sure that you change the settings for this indicator so that it plots arrows # up for upfractal plots # down for downfractal plots # # can be used and modified by anyone for any reason. do not sell. declare upper; def isupfractal; def isdownfractal; # Looking for high and low series of equalities # checking for possible fractal formation rec hicount = If (high == high[1], hicount[1] + 1, 0); rec hivalid = If ( (hicount[1] == 0 and hicount == 1 and high > high[2] and high > high[3]) or (hicount[1] and hicount and hivalid[1]) or (hicount[2] and hivalid[2] and high == high[2] and high > high[1]), 1, 0); rec locount = If (low == low[1], locount[1] + 1, 0); rec lovalid = If ( (locount[1] == 0 and locount == 1 and low < low[2] and low < low[3]) or (locount[1] and locount and lovalid[1]) or (locount[2] and lovalid[2] and low == low[2] and low < low[1]), 1, 0); # Checking for a traditional or non-standard up fractal isupfractal = If( ((hicount and hivalid) or (high > high[1] and high > high[2])) and high > high[-1] and high > high[-2], high, 0); # Checking for a traditional or non-standard down fractal isdownfractal = If( ((locount and lovalid) or (low < low[1] and low < low[2])) and low < low[-1] and low < low[-2], low, 0); plot upfractal = If(isupfractal, isupfractal + (1 * TickSize()), Double.NaN); upfractal.SetPaintingStrategy(PaintingStrategy.TRIANGLES); upfractal.SetLineWeight(5); plot downfractal = If(isdownfractal, isdownfractal - (1 * TickSize()), Double.NaN); downfractal.SetPaintingStrategy(PaintingStrategy.TRIANGLES); downfractal.SetLineWeight(5); def up = if isupfractal then high else up[1]; plot upline = up; upline.SetPaintingStrategy(PaintingStrategy.HORIZONTAL); def dn = if isdownfractal then low else dn[1]; plot dnline = dn; dnline.SetPaintingStrategy(PaintingStrategy.HORIZONTAL);