Montana101x
New member
I am new here and a ThinkorSwim user. My goal is to become a Pro Swing Trader particularly on mid or small good Caps. I found quite few indicators on site while researching but they are customized for other platforms. I know but take it easy on me and I am on process of learning and growing.
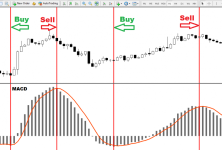
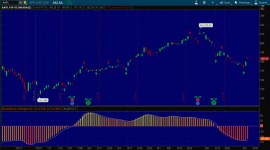
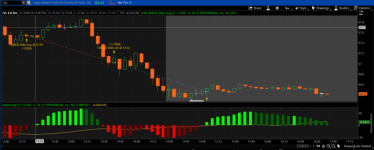
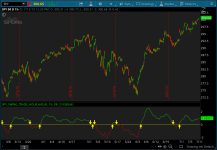
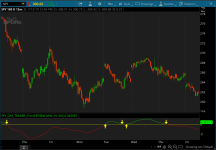
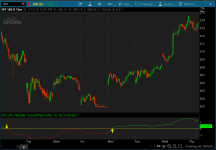
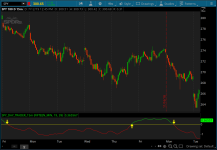
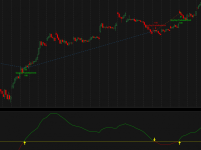
I found so many awesome indicators but only have their images. There’s one indicator and I hope someone can code this it would be awesome. It’s MACD with SMA and works awesome for swing trading... find attached blew and let help each other....
What's the best way to scan stocks for swing trading that are close to hitting their bottom?

Here is the CODE and hope everyone enjoys, modify it and improve and make it share it here with us.

I found so many awesome indicators but only have their images. There’s one indicator and I hope someone can code this it would be awesome. It’s MACD with SMA and works awesome for swing trading... find attached blew and let help each other....
What's the best way to scan stocks for swing trading that are close to hitting their bottom?
Here is the CODE and hope everyone enjoys, modify it and improve and make it share it here with us.
Rich (BB code):
declare lower;

input length = 9;
input colorNormLength = 14;
input price = close;
input signalLength = 3;

def tr = ExpAverage(ExpAverage(ExpAverage(Log(price), length), length), length);

plot TRIX = (tr - tr[1]) * 10000;
plot Signal = ExpAverage(TRIX, signalLength);
plot ZeroLine = 0;

def normVal = FastKCustom(AbsValue(TRIX), colorNormLength);

TRIX.SetDefaultColor(GetColor(8));
TRIX.AssignValueColor(CreateColor(255, (240 - (100 - (if TRIX > 0 then normVal else (-normVal))) * 175 / 200), 0));
ZeroLine.SetDefaultColor(GetColor(5));
Signal.setDefaultColor(GetColor(3));
TRIX.SetPaintingStrategy(PaintingStrategy.HISTOGRAM);
Attachments
Last edited:

