Repaints Best Swing Trading Indicators for ThinkorSwim

Repaints

Montana101x

New member
I am new here and a ThinkorSwim user. My goal is to become a Pro Swing Trader particularly on mid or small good Caps. I found quite few indicators on site while researching but they are customized for other platforms. I know but take it easy on me and I am on process of learning and growing.

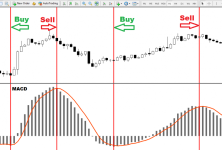
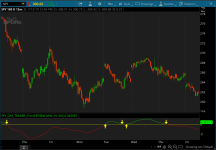
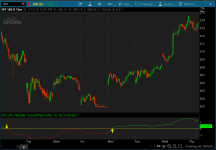
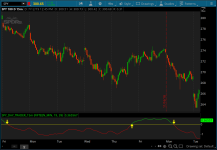
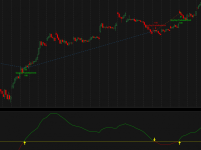
I found so many awesome indicators but only have their images. There’s one indicator and I hope someone can code this it would be awesome. It’s MACD with SMA and works awesome for swing trading... find attached blew and let help each other....

What's the best way to scan stocks for swing trading that are close to hitting their bottom?

vJAkCIf.png


Here is the CODE and hope everyone enjoys, modify it and improve and make it share it here with us.

4ZoEA9h.png


Rich (BB code):
declare lower;

input length = 9;
input colorNormLength = 14;
input price = close;
input signalLength = 3;

def tr = ExpAverage(ExpAverage(ExpAverage(Log(price), length), length), length);

plot TRIX = (tr - tr[1]) * 10000;
plot Signal = ExpAverage(TRIX, signalLength);
plot ZeroLine = 0;

def normVal = FastKCustom(AbsValue(TRIX), colorNormLength);

TRIX.SetDefaultColor(GetColor(8));
TRIX.AssignValueColor(CreateColor(255, (240 - (100 - (if TRIX > 0 then normVal else (-normVal))) * 175 / 200), 0));
ZeroLine.SetDefaultColor(GetColor(5));
Signal.setDefaultColor(GetColor(3));
TRIX.SetPaintingStrategy(PaintingStrategy.HISTOGRAM);
 

Attachments

  • vJAkCIf.png
    vJAkCIf.png
    185.9 KB · Views: 311
  • 4ZoEA9h.png
    4ZoEA9h.png
    210.2 KB · Views: 231
Last edited:

Volatility Trading Range

VTR is a momentum indicator that shows if a stock is overbought or oversold based on its Weekly and Monthly average volatility trading range.

Download the indicator

Think this is what you ask for. I am not an expert coder but this should do.

GATAo01.png


You will need to decide when to exit and what STOPS to use.

Strategy

Rich (BB code):
input tradesize = 1;

input price = close;

#MACD

input fastLength = 12;
input slowLength = 26;
input MACDLength = 9;
input averageType = AverageType.EXPONENTIAL;
input showBreakoutSignals = no;

plot Diff = MACD(fastLength, slowLength, MACDLength, averageType).Diff;
plot UpSignal = if Diff crosses above 0 then 0 else Double.NaN;
plot DownSignal = if Diff crosses below 0 then 0 else Double.NaN;

UpSignal.SetHiding(!showBreakoutSignals);
DownSignal.SetHiding(!showBreakoutSignals);

Diff.SetDefaultColor(GetColor(5));
Diff.SetPaintingStrategy(PaintingStrategy.HISTOGRAM);
Diff.SetLineWeight(3);
Diff.DefineColor("Positive and Up", Color.GREEN);
Diff.DefineColor("Positive and Down", Color.DARK_GREEN);
Diff.DefineColor("Negative and Down", Color.RED);
Diff.DefineColor("Negative and Up", Color.DARK_RED);
Diff.AssignValueColor(if Diff >= 0 then if Diff > Diff[1] then Diff.color("Positive and Up") else Diff.color("Positive and Down") else if Diff < Diff[1] then Diff.color("Negative and Down") else Diff.color("Negative and Up"));

#SMA
input lengthema = 34;

def AvgSMA = SimpleMovingAvg(Diff, lengthema);

#Orders
def bull = Diff crosses above AvgSMA;

def bear = Diff crosses below AvgSMA;

#Orders
AddOrder(OrderType.BUY_AUTO, bull, close, tradeSize, Color.ORANGE, Color.ORANGE, "MACD SMA buy @ " + close);

AddOrder(OrderType.SELL_AUTO, bear, close, tradeSize , Color.ORANGE, Color.ORANGE, "MACD SMA sell @ " + close);

STUDY

Rich (BB code):
Declare Lower;

input tradesize = 1;

input price = close;

#MACD

input fastLength = 12;
input slowLength = 26;
input MACDLength = 9;
input averageType = AverageType.EXPONENTIAL;
input showBreakoutSignals = no;

plot Diff = MACD(fastLength, slowLength, MACDLength, averageType).Diff;
plot UpSignal = if Diff crosses above 0 then 0 else Double.NaN;
plot DownSignal = if Diff crosses below 0 then 0 else Double.NaN;

UpSignal.SetHiding(!showBreakoutSignals);
DownSignal.SetHiding(!showBreakoutSignals);

Diff.SetDefaultColor(GetColor(5));
Diff.SetPaintingStrategy(PaintingStrategy.HISTOGRAM);
Diff.SetLineWeight(3);
Diff.DefineColor("Positive and Up", Color.GREEN);
Diff.DefineColor("Positive and Down", Color.DARK_GREEN);
Diff.DefineColor("Negative and Down", Color.RED);
Diff.DefineColor("Negative and Up", Color.DARK_RED);
Diff.AssignValueColor(if Diff >= 0 then if Diff > Diff[1] then Diff.color("Positive and Up") else Diff.color("Positive and Down") else if Diff < Diff[1] then Diff.color("Negative and Down") else Diff.color("Negative and Up"));

#SMA
input lengthema = 34;

plot AvgSMA = SimpleMovingAvg(Diff, lengthema);
 

Attachments

  • GATAo01.png
    GATAo01.png
    105.1 KB · Views: 215
Last edited by a moderator:
Take notes

18:42 JohnnyQuotron: the only swing trading I do, which really isn't swing trading is to wait for a stock/company which has performed well to drop to its first lower std error channel then beginning to revert back. The reversion back will often be indicated by the TMO. BUT when the trip below the centerline to the first std error is concurrent with a downward trend marked by an earnings date I tend to just watch rather than initiate a trade.
12:24 Mobius: There's 3 basic ways to make money in the Stock Market. Investing, Swing Trading and Intraday Trading. The most likely way anyone without a great deal of market education but with a reasonable amount of effort to learn can make money in the market is Investing. Learning how to invest and most importantly when to invest carries with it the greatest edge for the retail trader with limited capital.
 
I wanted to share an indicator I've been toying with for quite some time. It uses the TrendQuality indicator built into TOS as its base. It's currently optimized for the 1 hour chart using aggregation periods 1 hour and 3 days - I use it for swing trading. 1 = LONG, 0 = HOLD, -1 = SHORT.

Code:
#########
# SETUP #
#########

declare lower;

input fastLength = 7;
input slowLength = 15;
input trendLength = 4;
input noiseLength = 250;
input correctionFactor = 2;

assert(trendLength > 0, "'trend length' must be positive: " + trendLength);
assert(correctionFactor > 0, "'correction factor' must be positive: " + correctionFactor);

def smf = 2 / (1 + trendLength);

########
# LOGIC #
########

def reversal = sign(ExpAverage(close(period = AggregationPeriod.HOUR), fastLength) - ExpAverage(close(period = AggregationPeriod.HOUR), slowLength));

def cpc = if isNaN(reversal[1]) then 0 else if reversal[1] != reversal then 0 else cpc[1] + close(period = AggregationPeriod.THREE_DAYS) - close(period = AggregationPeriod.THREE_DAYS)[1];

def trend = if isNaN(reversal[1]) then 0 else if reversal[1] != reversal then 0 else trend[1] * (1 - smf) + cpc * smf;

def noise;
def diff = AbsValue(cpc - trend);

noise = correctionFactor * Average(diff, noiseLength);

def TQ = if noise == 0 then 0 else trend / noise;

########
# TRADE #
########

plot swing = if TQ > 0 then 1 else if TQ < 0 then -1 else 0;

swing.AssignValueColor( if TQ > 0 then Color.GREEN else if TQ < 0 then Color.RED else Color.Yellow);
 
This indicator was designed to trade the S&P 500 (SPY) on a weekly chart. Developer Waylock created it and AlphaInvestor added weekly aggregation.

I modified the script a bit so that you can use it to day trade and swing trade $SPY on the lower timeframe.

From backtesting, the buy and sell signals worked really well. You may want to take a second look and see if this is something that may fit your trading style. I also added alerts in the code so that ThinkorSwim will let you know when there is a new bullish or bearish signal.

kbCFwQt.png

b5reLvA.png

wPI1xTz.png


Day Trading Version

Code:
# Original name: Big_Hand_Arrows_On_Study_w_Agg

# Script by Waylock

# AlphaInvestor - 05/12/2017 - force to weekly aggregation

# Modified by BenTen to work on lower timeframe. Alerts added.

declare lower;

input agg = AggregationPeriod.FIFTEEN_MIN;

input fastLength = 19;

input slowLength = 39;

def c = close(period = agg);

plot Value = ExpAverage(c, fastLength) - ExpAverage(c, slowLength);

def Value_color = if Value > 0 then yes else no;

Value.DefineColor( "ValueUp", Color.GREEN );

Value.DefineColor( "ValueDn", Color.RED );

Value.AssignValueColor( if Value_color then Value.Color( "ValueUp" ) else Value.Color( "ValueDn" ) );

plot ZeroLine = 0;

Value.SetDefaultColor(Color.CYAN);

ZeroLine.SetDefaultColor(Color.YELLOW);

ZeroLine.HideTitle();

ZeroLine.HideBubble();

def xUndr = Value[1] < 0 and Value > 0;

def xOver = Value[1] > 0 and Value < 0;

plot ArrowUp = if xUndr then xOver else Double.NaN;

ArrowUp.SetPaintingStrategy(PaintingStrategy.ARROW_UP);

ArrowUp.SetDefaultColor(Color.YELLOW);

ArrowUp.SetLineWeight(5);

ArrowUp.HideTitle();

ArrowUp.HideBubble();

plot ArrowDn = if xOver then xUndr else Double.NaN;

ArrowDn.SetPaintingStrategy(PaintingStrategy.ARROW_DOWN);

ArrowDn.SetDefaultColor(Color.YELLOW);

ArrowDn.SetLineWeight(5);

ArrowDn.HideTitle();

ArrowDn.HideBubble();

def data = Value;

# Alerts
Alert(ArrowUp, " ", Alert.Bar, Sound.Chimes);
Alert(ArrowDn, " ", Alert.Bar, Sound.Bell);

# End Study

Shareable Link: https://tos.mx/wJd6hZ

Swing Trading Version

oZs7YnY.png


Code:
# Original name: Big_Hand_Arrows_On_Study_w_Agg

# Script by Waylock

# AlphaInvestor - 05/12/2017 - force to weekly aggregation

# Modified by BenTen to work on lower timeframe. Alerts added.

declare lower;

input agg = AggregationPeriod.HOUR;

input fastLength = 19;

input slowLength = 39;

def c = close(period = agg);

plot Value = ExpAverage(c, fastLength) - ExpAverage(c, slowLength);

def Value_color = if Value > 0 then yes else no;

Value.DefineColor( "ValueUp", Color.GREEN );

Value.DefineColor( "ValueDn", Color.RED );

Value.AssignValueColor( if Value_color then Value.Color( "ValueUp" ) else Value.Color( "ValueDn" ) );

plot ZeroLine = 0;

Value.SetDefaultColor(Color.CYAN);

ZeroLine.SetDefaultColor(Color.YELLOW);

ZeroLine.HideTitle();

ZeroLine.HideBubble();

def xUndr = Value[1] < 0 and Value > 0;

def xOver = Value[1] > 0 and Value < 0;

plot ArrowUp = if xUndr then xOver else Double.NaN;

ArrowUp.SetPaintingStrategy(PaintingStrategy.ARROW_UP);

ArrowUp.SetDefaultColor(Color.YELLOW);

ArrowUp.SetLineWeight(5);

ArrowUp.HideTitle();

ArrowUp.HideBubble();

plot ArrowDn = if xOver then xUndr else Double.NaN;

ArrowDn.SetPaintingStrategy(PaintingStrategy.ARROW_DOWN);

ArrowDn.SetDefaultColor(Color.YELLOW);

ArrowDn.SetLineWeight(5);

ArrowDn.HideTitle();

ArrowDn.HideBubble();

def data = Value;

# Alerts
Alert(ArrowUp, " ", Alert.Bar, Sound.Chimes);
Alert(ArrowDn, " ", Alert.Bar, Sound.Bell);

# End Study

Shareable Link: https://tos.mx/VevVxf
 

Attachments

  • oZs7YnY.png
    oZs7YnY.png
    107 KB · Views: 183
  • wPI1xTz.png
    wPI1xTz.png
    84.2 KB · Views: 190
  • b5reLvA.png
    b5reLvA.png
    84.9 KB · Views: 169
  • kbCFwQt.png
    kbCFwQt.png
    86.1 KB · Views: 173
@BenTen Here is the backtest code for this strategy

Strategy:

Code:
input agg = AggregationPeriod.FIFTEEN_MIN;

input TradeSize = 100;

input fastLength = 19;

input slowLength = 39;

def c = close(period = agg);

Def Value = ExpAverage(c, fastLength) - ExpAverage(c, slowLength);

def B =   Value[1] < 0 and Value > 0;

def S =   Value[1] > 0 and Value < 0 ;

AddOrder(OrderType.BUY_AUTO, condition = B, price = open[-1], TradeSize, tickcolor = Color. GREEN, arrowcolor = Color.GREEN);

AddOrder(OrderType.SELL_AUTO, condition = S, price = open[-1], TradeSize, tickcolor = Color.RED, arrowcolor = Color.RED);

SPY 90 Day 1 Hr Time Frame Results:
Max trade P/L: $964.00
Total P/L: $723.98
Total order(s): 12

H3ZXOQb.png
 

Attachments

  • H3ZXOQb.png
    H3ZXOQb.png
    133.7 KB · Views: 158
I'm attempting to identify stocks with good upward momentum (from a day/swing trading perspective) in vain. I have tried using ThinkScript to check for Parabolic SAR in conjunction with either MACD or Stochastics. I'm swing trading weekly options using fib retracements and when the stock price pulls away from the monthly VWAP. Perhaps, my criteria is not sound enough. I would appreciate suggestions.
 
I'm new here and between the OneNote and information on this site, I am amazed at the amount of knowledge and information available! However, after reading and searching for a week I can't find anything that seems like it would help me with what I am trying to do. So to start I will explain a bit about how I trade and what I would like to do.

About 6 months ago I threw 5k into a ToS account, I have read about trading for years and practiced paper-trading for about a month before opening my account. Due to the limited funds in my account, I have leaned towards trading options (not interested in penny stocks). In paper trading, I was pretty profitable using options strategies that I am unable to do with my current account. So I tried to day trade, and I am pretty good at it but I am limited to 3 trades per week. My intention is to grow my account as quickly as possible so that I can day trade and use options strategies both of which I have had the most success with. I currently work full time and I am a single parent and would prefer to have less stress and a more flexible schedule and I enjoy trading so my hope is that in the next 1 to 3 years I will be able to offset my current income with trading and start doing it full time.

With all of that being said I have spent a lot of time testing (with real money) strategies for swing trades I can hold overnight (preferable) or up to two or three days. I am not a big fan of holding for longer at the minute as I prefer more liquidity to get in into a good day trade when I find it since I am limited to three. But I have actually been losing money trying to do overnight holds. The ones I have been right about the price the next day get drove the opposite direction in pre-market and open much higher or lower before making the gain or loss I expected to see, others it just didn't happen, I've also had some bad news destroy a position and one trade that I missed that earnings were coming out the next day and the below expected earnings tanked my position. I have learned things from all of these, but the biggest thing I have learned is that nothing I have been doing is consistent enough for overnight holds.

Typically, for my day trades, I use MACD, RSI, and a couple of moving averages along with hand-drawn trend / support / resistance lines and candlestick / price action, but these things have not translated well to my overnight hold attempts.

So I am wondering if anyone has any preferred indicators, and or strategies that they have had decent success with for overnight or short term swing trades?
 
To begin with, it depends on which particular market you're trading. With that in mind, it is neither the tool nor technique so much, but the features of the market that count and define if an idea might work. What inevitably happens when you rely on the aforementioned indicators, is inferences are made which reflect a secondary process, not a primary one. This involves compliance of the indicators with fundamentals and/or a pre-conceived cognitive bias.

Most indicators that are derivatives of price, track price changes; and, if there is persistence (the future is like the past) they inevitably end up contributing to the myth that they are predictive. This is why it's important that a trader have a foundation of contextual knowledge about the market he(she) is trading including an understanding of what really drives price, before they attempt to take their trading to the next level. It requires an approach built on an analytical framework that is relevant to current drivers of price. An approach that provides quick feedback to alert you of failure as soon as possible, and an approach that is both correlated to the asset class you are trading, and the current market regime. //g
 
Thanks gapcap! Good advice and something I have been struggling with, I am not sure where to begin gaining all of that knowledge with the way I currently trade.

My base scans are all optionable stock with avg_volume > 972k, and atr > 1.25

Maybe I should pick 5 to 10 stocks to focus on and try to get a better understanding of them. I focused on a larger group hoping to get more trading opportunities but maybe that's not the best route.

As far as what drives the price, any recommendations on the best way to gain that knowledge? Fundamentals, news, what else?
 
@mn88 This is more of a side note than an answer to your questions, but you can have a cash account and day trade options and you don’t fall under the PDT rule of 3 trades per week. That only applies to margin accounts. With cash accounts you can trade options as much as you want, especially now that commissions are like $0.65 per option contract. Also, funds settle T+1.
 
@TK_44 Thank you for the information, I will have to call TD Ameritrade today because my account is cash, and I cannot do option strategies on margin but it looks like I can do stocks on margin. Maybe I set it up wrong when I opened it.
 
@mn88 This is something I wrote for Victor Niederhoffer's spec-list over the weekend. Notice there is no mention of indicators, nor trendlines, nor traditional chart formations.

In summary, the outlook is bullish because of the strong momentum in the market and the lack of sell signals. A market like this can produce complacency, but that is the one thing we can control -- we can and must avoid becoming complacent. But, for now, enjoy the run to the upside.

This is dated 12/27/2019, and written by very well respected professional trader and best-selling author. The irony is self-evident as the author's reflections are at odds with his actions. His conscious thoughts and written words belie his unconscious behavior because it is stuck on "bull autopilot". These comments come in the wake of a day that saw a 6% bump in volatility and late "smart money" selling into the close. In a high positive gamma environment, we should be witnessing smaller ranges, low volatility, and mean reverting price action.

It brings to mind a quote by a prominent member of the the spec-list. "The market and its history are identical for all observers. Yet the market and its future are understood uniquely by each one. So the debate shall always continue, because no two minds are alike".

I believe I witnessed the same market action today; but I am far less sanguine about its future. Not unlike the talented Mr.Vince, who is redefining the term "variant perception", I believe ES will move pretty quickly to the 3200 level. Even by the most mundane thinking, this level was previously resistance and now becomes support. In addition, there is a fair amount of put open interest at that strike. I won't venture a guess beyond that level, because "a guess" is exactly what it would be. However, the 3120 level is the area where gamma flips and could spark selling as negative gamma kicks in. Major support is 3020-3000.
The buyback index $SPBUYUP is exhibiting a very similar picture to that of SVXY, and while the VIX hasn't reached a level where one should be overly concerned (+15) it's getting close. However, VIX term structure has been over-extended for days, and has breached a level which coincides with market sell-offs.

The rally in gold may be nothing more than a squeeze that will be suppressed by banks, once again; but it also may be pricing unknown negative news into the market. The same can be said for the U.S. Dollar, which has weakened dramatically, especially against gold. Hedge funds may be selling their dollars to unwind carry trades due to a lack of liquidity. If bonds were to fail from current levels, it could be for the very same reason.

Jan. 3 is the payrolls number, and Jan. 6 is expiration for 25B in cash loans offered to banks to help insure interest rate stability. Between now and EOY, regulators will be watching bank balance sheets. Both of these events present possible landmines that could further derail the bull market.

That being said, one never knows if they are truly defining the context of the market; nevertheless creating the ability to establish timing. And if by luck they find success; there is still the uncertainty that they have been fooled by random luck into thinking their ideas were really predictive. A great deal of the information we look at reflects a secondary process and should be ignored. Ralph has developed the process into an art form. He knows exactly what to look for, and exactly how to look at it.

For me, I'm always working on my decision quality. Uncertainty is always going to be there; and the best I can hope to achieve is as probabilistic knowledge of the market environment as possible.
 
@gapcap1 we are fortunate to have a trader of your stature and experience here at useThinkScript. If it hasn't been said yet, Welcome, from @BenTen and @markos !

There are a number of ORB traders here, although this thread is about overnight holding, could you speak specifically to your experience of basing stock or stock option day trades off of pre-market hours? I do not wish to give my disposition because although I could day trade, I am a daily/weekly chart watcher now.
 
Thanks for the gracious welcome, Markos! Personally, I don't trade stocks. When I first left the floor I traded SPY, Q's, AAPL and GOOG. I had 30-1 leverage, and I was spending about $4000 per day in commissions. So, I went back to trading futures and never looked back. Stocks are difficult to short and I can't get that kind of leverage anymore. Futures solves both problems.

As far as trading the open based off the ETH trade, it would depend on the particular instrument's overnight seasonality and whether the market was mean reverting or trending at the time. Looking at Market Profile and incorporating the 80% rule along with your ORB indicator would be good practice.

In very general terms long gamma hedging leads to intra-day reversion and close-to-close trending, and negative or short gamma hedging is mean reverting near the open. In any case, I am never in a hurry to trade the opening, unless it is warranted i.e., an "open drive" type of opening.

Generally speaking, the shorter the time-frame, the more random the market, the greater the capacity issues, and the greater the model risk. Short term, the market is all driven by news and algos. Short term trading comes down to money management. It is essential that a high win rate is attained in conjunction with high expectancy, because the risk of ruin is a function of the loss rate. If your method does not have a high enough win rate then the risk of ruin will be greater due to the inevitability of an idiosyncratic loss or consecutive losers. With transaction costs, slippage, and the competition from the machines, it's really a fools errand.
 
@gapcap1 Thank you for the additional information, charts and for giving me a glimpse of some of the market aspects you consider. I was familiar with some of these as possible drivers of the market but not really sure how you would determine a correlation between them and then use them to come up with an outlook. Great stuff, and humbling as I realize I have such a long journey of learning ahead of me :)


@TK_44 you were definitely correct about cash account, but that also comes with some limitations of its own so I am weighing the pros and cons now and trying to decide if I would like to switch my account or not. either way, I appreciate the information as I was not aware there were any other options for me atm.
 
@mn88 Consider learning about & looking into "Buying" Put or Call Option spreads on a list of Active Option Stocks & ETF's. Trade small and trade often should be your mantra. About 30 Days to Expiration (DTE) , $2.00 wide & sell with a 55% gain. Once "BOT", it can be set up to Sell GTC at 55% above the purchase price. You'll probably be able to get a 1 contract spread on a $20 - $30 stock without trouble. Just a thought.
The Above is an example and should NOT be considered trading advice. Check the Tutorials Area for some excellent "how to's" by @theelderwand
 
Hey guys,

Trying to give back here a little. I modified this strategy to be compatible with mobile. It will work on whatever period you have it on. I work full time and having a screen in front of me is impossible. My plan is to set alerts and use this specifically for stocks on a higher time frame for swing trading options. 1 hour or 4 hour agg. I don't have it coded to add arrows or alerts, modified the period to whatever current period you have it on in the mobile app. Hope this helps someone.
Code:
# Original name: Big_Hand_Arrows_On_Study_w_Agg

# Script by Waylock

# AlphaInvestor - 05/12/2017 - force to weekly aggregation

# Modified by BenTen to work on lower timeframe. Alerts added.

#Modified by Jim C for Mobile and standard period

declare lower;


input fastLength = 19;

input slowLength = 39;

def c = close;

plot Value = ExpAverage(c, fastLength) - ExpAverage(c, slowLength);

def Value_color = if Value > 0 then yes else no;

Value.DefineColor( "ValueUp", Color.GREEN );

Value.DefineColor( "ValueDn", Color.RED );

Value.AssignValueColor( if Value_color then Value.Color( "ValueUp" ) else Value.Color( "ValueDn" ) );

plot ZeroLine = 0;

Value.SetDefaultColor(Color.CYAN);

ZeroLine.SetDefaultColor(Color.YELLOW);

ZeroLine.HideTitle();

ZeroLine.HideBubble();

def xUndr = Value[1] < 0 and Value > 0;

def xOver = Value[1] > 0 and Value < 0;

plot ArrowUp = if xUndr then xOver else Double.NaN;

ArrowUp.SetPaintingStrategy(PaintingStrategy.ARROW_UP);

ArrowUp.SetDefaultColor(Color.YELLOW);

ArrowUp.SetLineWeight(5);

ArrowUp.HideTitle();

ArrowUp.HideBubble();

plot ArrowDn = if xOver then xUndr else Double.NaN;

ArrowDn.SetPaintingStrategy(PaintingStrategy.ARROW_DOWN);

ArrowDn.SetDefaultColor(Color.YELLOW);

ArrowDn.SetLineWeight(5);

ArrowDn.HideTitle();

ArrowDn.HideBubble();

def data = Value;

# Alerts
Alert(ArrowUp, " ", Alert.Bar, Sound.Chimes);
Alert(ArrowDn, " ", Alert.Bar, Sound.Bell);

# End Study
 
I'm no coder myself but I still like to make strategies out of other indicators. Here is a simple one I whipped up today using the TMO and MACD. Its goal is to catch signals slightly before the MACD and play off oversold/overbought zones on the TMO.

The OB/OS values make this indicator, set lower values and the criteria is less strict and therefore sometimes produces less consistent signals. Put it closer to 1 and it will make signals rarer yet more effective. Right now I have the settings at .9 for overbought and .6 for oversold. These are uneven because I believe it better fits the current bull market. If you are using this on a stock, understand its long term trend and adjust the zones if you wish. For example on a stock like GME crank the OS value up to something like .9, then make the OB value something like .6. If these zones are adequately adjusted I'd say it has around 60% accurate signals.

I haven't had much time to test the indicator but it looks solid on the 1d. I plan on using this to scan for stocks that could be promising. Along with some basing trading knowledge I think the signal accuracy could be boosted to around 80%. This is very simple and I'm sure there are many other ways it can be improved. Do you guys have any ideas? Also I was thinking wondering if I could draw any connections between this and the market moves indicator, does anyone have a version that scales properly? When I put an sma over a rsi is doesn't work.

eoKlFBW.png


qU7r6S2.png


The code is not organized at all, nor are the inputs. I'm not good at sorting through that kind of thing. Bullish and bearish are the only plots that should be used.

Code:
def c = close;
def h = high;
def l = low;
def o = open;


input length = 14;
input calcLength = 5;
input smoothLength = 3;

def op = open;
def cl = close;
def data = fold i = 0 to length
           with s
           do s + (if cl > GetValue(op, i)
                   then 1
                   else if cl < GetValue(op, i)
                        then - 1
                        else 0);
def EMA5 = ExpAverage(data, calcLength);
plot Main = ExpAverage(EMA5, smoothLength);
plot Signal = ExpAverage(Main, smoothLength);
Main.AssignValueColor(if Main > Signal
                           then Color.GREEN
                           else Color.RED);
Signal.AssignValueColor(if Main > Signal
                             then Color.GREEN
                             else Color.RED);

AddCloud(Main, Signal, Color.GREEN, Color.RED);
def zero = if IsNaN(cl) then Double.NaN else 0;

def obtmo = if IsNaN(cl) then Double.NaN else Round(length * .85);

def ostmo = if IsNaN(cl) then Double.NaN else -Round(length * .60);

AddCloud(obtmo, length, Color.LIGHT_RED, Color.LIGHT_RED, no);
AddCloud(-length, ostmo, Color.LIGHT_GREEN, Color.LIGHT_GREEN);

input fastLength = 12;
input slowLength = 26;
input MACDLength = 9;
input averageType2 = averageType.Exponential;
input showBreakoutSignals = no;

def Value = MovingAverage(averageType2, close, fastLength) - MovingAverage(averageType2, close, slowLength);
def Avg = MovingAverage(averageType2, Value, MACDLength);

def Diff = Value - Avg;
def ZeroLine = 0;

def Condition1 = if
Value [1] < Avg [1] and
Value > Avg
then 1 else Double.NaN;
plot x = Condition1;
x.SetPaintingStrategy(paintingStrategy = PaintingStrategy.BOOLEAN_ARROW_UP);

def Condition2 = if
Value [1] > Avg [1] and
Value < Avg
then 1 else Double.NaN;
plot q = Condition2;
q.SetPaintingStrategy(paintingStrategy = PaintingStrategy.BOOLEAN_ARROW_DOWN);

#
# TD Ameritrade IP Company, Inc. (c) 2007-2019
#
input lengthrsi = 14;
input over_Bought = 70;
input over_Sold = 30;
input price = close;
input averageType = averageType.Wilders;
input showBreakoutSignalsrsi = no;

def NetChgAvg = MovingAverage(averageType, price - price[1], length);
def TotChgAvg = MovingAverage(averageType, AbsValue(price - price[1]), length);
def ChgRatio = if TotChgAvg != 0 then NetChgAvg / TotChgAvg else 0;
plot RSI = 50 * (ChgRatio + 1);
plot OverSold = over_Sold;
plot OverBought = over_Bought;
plot UpSignal = if RSI crosses above OverSold then OverSold else Double.NaN;
plot DownSignal = if RSI crosses below OverBought then OverBought else Double.NaN;

UpSignal.SetHiding(!showBreakoutSignals);
DownSignal.SetHiding(!showBreakoutSignals);

RSI.DefineColor("OverBought", GetColor(5));
RSI.DefineColor("Normal", GetColor(7));
RSI.DefineColor("OverSold", GetColor(1));
RSI.AssignValueColor(if RSI > over_Bought then RSI.Color("OverBought") else if RSI < over_Sold then RSI.Color("OverSold") else RSI.Color("Normal"));
OverSold.SetDefaultColor(GetColor(8));
OverBought.SetDefaultColor(GetColor(8));
UpSignal.SetDefaultColor(Color.UPTICK);
UpSignal.SetPaintingStrategy(PaintingStrategy.ARROW_UP);
DownSignal.SetDefaultColor(Color.DOWNTICK);
DownSignal.SetPaintingStrategy(PaintingStrategy.ARROW_DOWN);

plot bullish = (Main > Signal) and (Signal < ostmo);
plot bearish = (Main < Signal) and (Signal > obtmo);

#STRATEGY
#def SS = if bullish then 100 else if bearish then -100 else 0

# def sBuy = SS crosses above 0;;
# def sSell = SS crosses below 0;

# AddOrder(OrderType.BUY_to_OPEN, condition = bullish, price = open[-1], 100, tickcolor = Color.GREEN, arrowcolor = Color.GREEN);
# AddOrder(Ordertype.SELL_TO_CLOSE, condition = bearish2, price = open[-1], 100, tickcolor = Color.GREEN,
# arrowcolor = Color.GREEN);
#AddOrder(OrderType.SELL_AUTO, condition = bearish, price = open[-1], 1000, tickcolor = Color.RED, arrowcolor = Color.RED);
#END OF trend, a momentum and a cycle based indicator for ThinkorSwim
 

New Indicator: Buy the Dip

Check out our Buy the Dip indicator and see how it can help you find profitable swing trading ideas. Scanner, watchlist columns, and add-ons are included.

Download the indicator

Similar threads

Not the exact question you're looking for?

Start a new thread and receive assistance from our community.

87k+ Posts
539 Online
Create Post

Similar threads

Similar threads

The Market Trading Game Changer

Join 2,500+ subscribers inside the useThinkScript VIP Membership Club
  • Exclusive indicators
  • Proven strategies & setups
  • Private Discord community
  • ‘Buy The Dip’ signal alerts
  • Exclusive members-only content
  • Add-ons and resources
  • 1 full year of unlimited support

Frequently Asked Questions

What is useThinkScript?

useThinkScript is the #1 community of stock market investors using indicators and other tools to power their trading strategies. Traders of all skill levels use our forums to learn about scripting and indicators, help each other, and discover new ways to gain an edge in the markets.

How do I get started?

We get it. Our forum can be intimidating, if not overwhelming. With thousands of topics, tens of thousands of posts, our community has created an incredibly deep knowledge base for stock traders. No one can ever exhaust every resource provided on our site.

If you are new, or just looking for guidance, here are some helpful links to get you started.

What are the benefits of VIP Membership?
VIP members get exclusive access to these proven and tested premium indicators: Buy the Dip, Advanced Market Moves 2.0, Take Profit, and Volatility Trading Range. In addition, VIP members get access to over 50 VIP-only custom indicators, add-ons, and strategies, private VIP-only forums, private Discord channel to discuss trades and strategies in real-time, customer support, trade alerts, and much more. Learn all about VIP membership here.
How can I access the premium indicators?
To access the premium indicators, which are plug and play ready, sign up for VIP membership here.
Back
Top