Awesome Oscillator (AO) Divergence Indicator for ThinkorSwim

BenTen

Administrative
Staff member
Staff
VIP
Lifetime
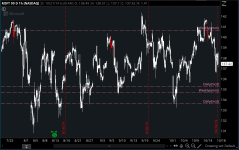
This indicator paints your candlesticks when a bullish divergence is found on both the RSI and the Awesome Oscillator and red when bearish divergence is found.

mod note:
Most divergence indicators look amazing in hindsight because they are repainters.
They wait for future pivots, then go back and paint perfect signals on old candles. This one doesn't.
It evaluates only the information available at the current bar, so once a candle closes its signal is locked in. That makes it a much more honest tool for live trading.

For day traders, divergence can be an early clue that momentum is fading before price actually reverses. It won't predict every turn, but it can help identify exhaustion and keep you from chasing moves that are already running out of steam. Used alongside your existing strategy, it adds another piece of context without rewriting history.
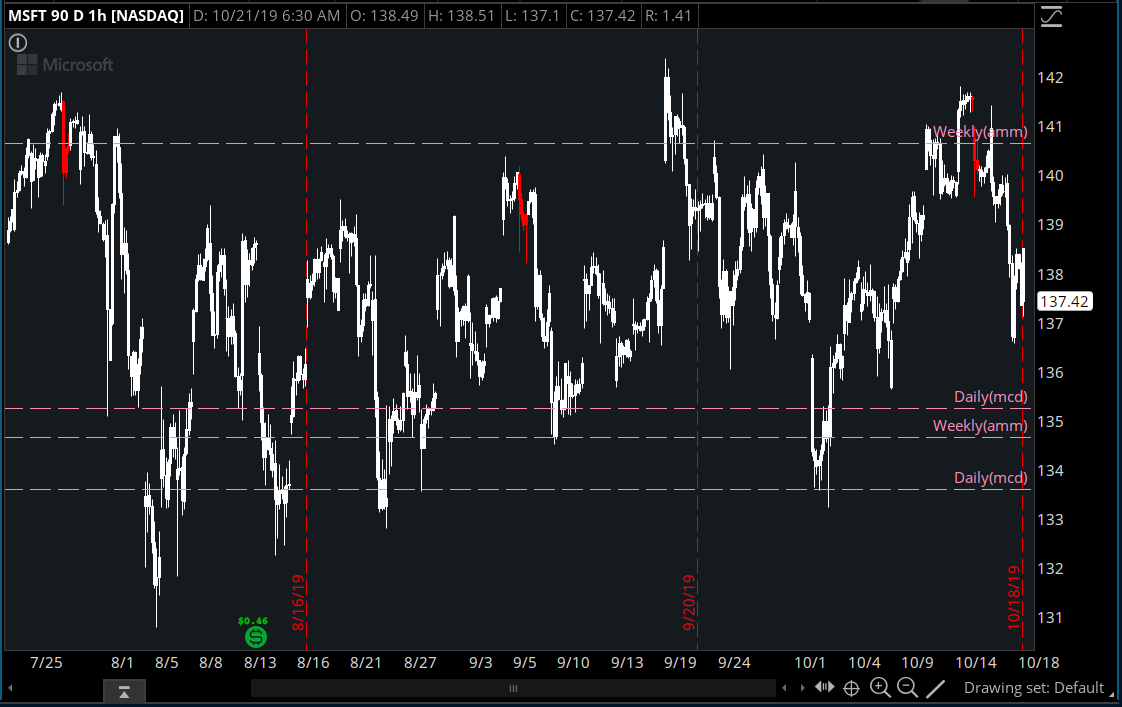

GIMkv1T.png

8xWDU0p.png


thinkScript Code

Code:
# Confirmed Divergence
# Assembled by BenTen at useThinkScript.com
# Converted from https://www.tradingview.com/script/PFsMAjcQ-Confirmed-Divergence/

input rsiprd = 14;
input source = close;
input averageType = AverageType.WILDERS;

def NetChgAvg = MovingAverage(averageType, source - source[1], rsiprd);
def TotChgAvg = MovingAverage(averageType, AbsValue(source - source[1]), rsiprd);
def ChgRatio = if TotChgAvg != 0 then NetChgAvg / TotChgAvg else 0;

def RSI = 50 * (ChgRatio + 1);

input length = 30;
input mult = 2.0;
input src = close;

input ob = 70;
input os = 30;
input lengthAO1 = 5;
input lengthAO2 = 34;
def rv = RSI;

def AO = simpleMovingAvg((high + low) / 2, lengthAO1) - simpleMovingAvg((high + low) / 2, lengthAO2);

input x = 5;
input z = 25;

def srcLL = src > lowest(src, x) and lowest(src, x)<lowest(src, z)[x];

def rsiHL = rv > lowest(rv, x) and lowest(rv, x) > lowest(rv, z)[x] and lowest(rv, z)<os;

def aoHL = AO > lowest(AO, x) and lowest(AO, x) > lowest(AO, z)[x] and lowest(AO, x) < 0;

def BullishDiv = srcLL and rsiHL and aoHL;

def srcHH = src < highest(src, x) and highest(src, x)>highest(src, z)[x];

def rsiLH = rv < highest(rv, x) and highest(rv, x) < highest(rv, z)[x] and highest(rv, z)>ob;

def aoLH = AO < highest(AO, x) and highest(AO, x) < highest(AO, z)[x] and highest(AO, x) > 0;

def BearishDiv = srcHH and rsiLH and aoLH;

def basis = simpleMovingAvg(source, length);
def dev = mult * stdev(source, length);

def upper = basis + dev;
def lower = basis - dev;

assignPriceColor(if BullishDiv then color.green else if BearishDiv then color.red else Color.white);
 

Attachments
  • GIMkv1T.png
    GIMkv1T.png
    71.6 KB · Views: 549
  • 8xWDU0p.png
    8xWDU0p.png
    78.8 KB · Views: 582
Last edited by a moderator:
Ben, instead of painting the bars, would you display the arrow of the first bar of divergence?
Thanks,
 
@iamtom07 Add the # sign in front of the assignPriceColor code and add the following script at the end of your script:

Code:
# Plot Signals
plot bullish = BullishDiv;
bullish.SetPaintingStrategy(PaintingStrategy.BOOLEAN_ARROW_UP);
bullish.SetDefaultColor(Color.CYAN);
bullish.SetLineWeight(1);
plot bearish = BearishDiv;
bearish.SetPaintingStrategy(PaintingStrategy.BOOLEAN_ARROW_DOWN);
bearish.SetDefaultColor(Color.CYAN);
bearish.SetLineWeight(1);
 
I mainly swing trades, is this useful for longer timeframes for Daily. Do you have TOS scanners that scan for stocks in a channel b.c I like to use Iron Condor strategy. Thanks
 
@scxpertise You can always backtest it by looking through your chart's timeframe with this indicator. Add this code to the end of your script and you should be able to scan for new signals. (Watch this video if you don't know how to).
 
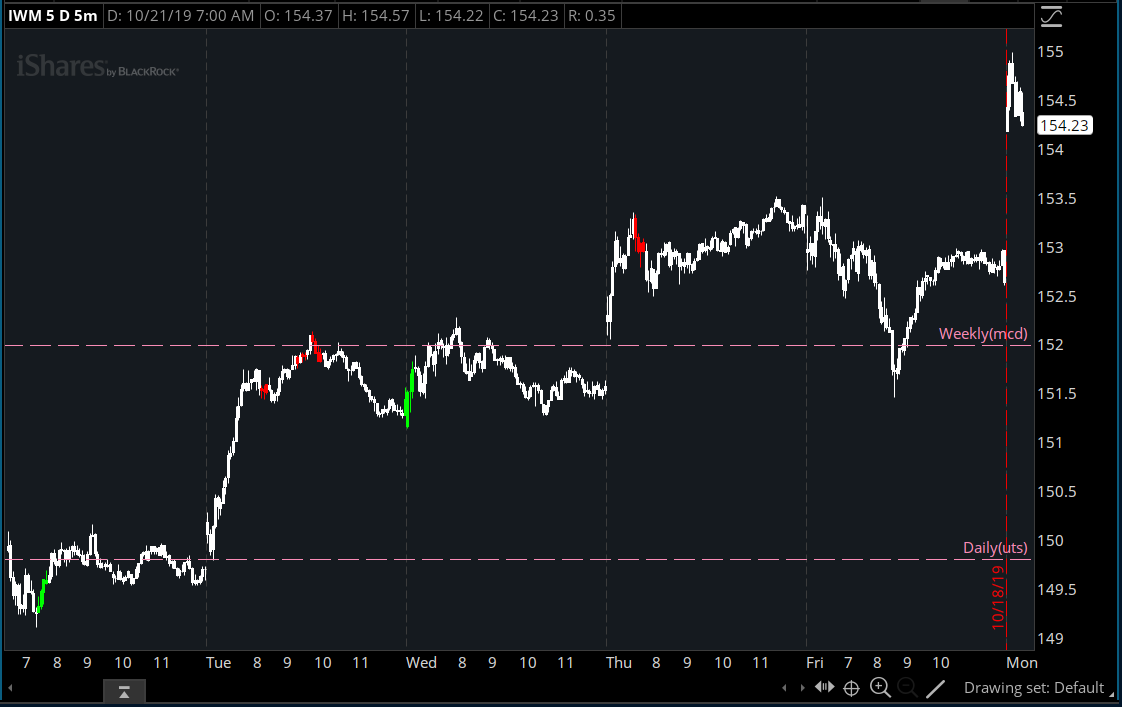
Hey @BenTen .....this is awesome! Very useful as I am a reversion to the mean trader. I'm also interested in making the conditions more lenient. I've reset OB/OS to 60/40 with some success and have also set the AO to 5, 20 instead of 5,34. There is one thing that I have a big question about tho. Here's the setup: I find that there are often strong "divergences" when price has simply met the closing price but has not actually met or exceeded (let's say) the lowest low. See the image below. At 9:10 I see a great "divergence", but price hasn't actually met the conditions. I see in your code for this that there is a lot of reference to "highest" and "lowest", but is there a way to modify the code to include conditions where price has simply met the lowest "close" and not the lowest "low"?

Thanks!

9mcgT4P.jpg
 
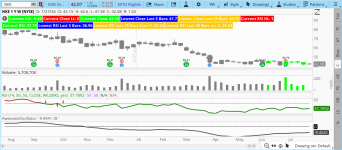
This script accurately identified 26.24 as the lowest RSI within a 25-lookback period. How can I enhance this script by pointing a down arrow at the 26.24 bar (4/6/26) on the chart?
 

Attachments

  • 2026-07-27-TOS_CHARTS NIKE.png
    2026-07-27-TOS_CHARTS NIKE.png
    97.4 KB · Views: 7
For touching the 26.24 level?
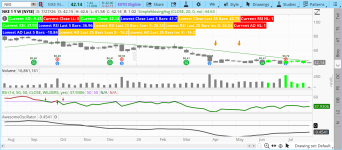
This might better show what I mean. Script identified 4/6 as the lowest RSI, and it identified 5/4 as the lowest AO. I manually added arrows pointing at these two bars. How do we make the existing script add the two arrows to point at the bars it has identified?
 

Attachments

  • 2026-07-27-TOS_CHARTS NIKE2.png
    2026-07-27-TOS_CHARTS NIKE2.png
    108.4 KB · Views: 1

Join useThinkScript to post your question to a community of 21,000+ developers and traders.

Similar threads

Not the exact question you're looking for?

Start a new thread and receive assistance from our community.

87k+ Posts
885 Online
Create Post

Similar threads

Similar threads

The Market Trading Game Changer

Join 2,500+ subscribers inside the useThinkScript VIP Membership Club
  • Exclusive indicators
  • Proven strategies & setups
  • Private Discord community
  • ‘Buy The Dip’ signal alerts
  • Exclusive members-only content
  • Add-ons and resources
  • 1 full year of unlimited support

Frequently Asked Questions

What is useThinkScript?

useThinkScript is the #1 community of stock market investors using indicators and other tools to power their trading strategies. Traders of all skill levels use our forums to learn about scripting and indicators, help each other, and discover new ways to gain an edge in the markets.

How do I get started?

We get it. Our forum can be intimidating, if not overwhelming. With thousands of topics, tens of thousands of posts, our community has created an incredibly deep knowledge base for stock traders. No one can ever exhaust every resource provided on our site.

If you are new, or just looking for guidance, here are some helpful links to get you started.

What are the benefits of VIP Membership?
VIP members get exclusive access to these proven and tested premium indicators: Buy the Dip, Advanced Market Moves 2.0, Take Profit, and Volatility Trading Range. In addition, VIP members get access to over 50 VIP-only custom indicators, add-ons, and strategies, private VIP-only forums, private Discord channel to discuss trades and strategies in real-time, customer support, trade alerts, and much more. Learn all about VIP membership here.
How can I access the premium indicators?
To access the premium indicators, which are plug and play ready, sign up for VIP membership here.
Back
Top