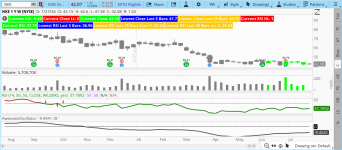
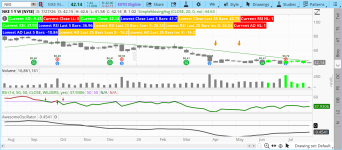
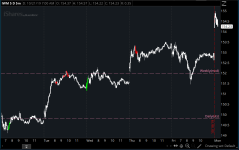
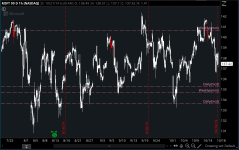
This indicator paints your candlesticks when a bullish divergence is found on both the RSI and the Awesome Oscillator and red when bearish divergence is found.
mod note:
Most divergence indicators look amazing in hindsight because they are repainters.
They wait for future pivots, then go back and paint perfect signals on old candles. This one doesn't.
It evaluates only the information available at the current bar, so once a candle closes its signal is locked in. That makes it a much more honest tool for live trading.
For day traders, divergence can be an early clue that momentum is fading before price actually reverses. It won't predict every turn, but it can help identify exhaustion and keep you from chasing moves that are already running out of steam. Used alongside your existing strategy, it adds another piece of context without rewriting history.
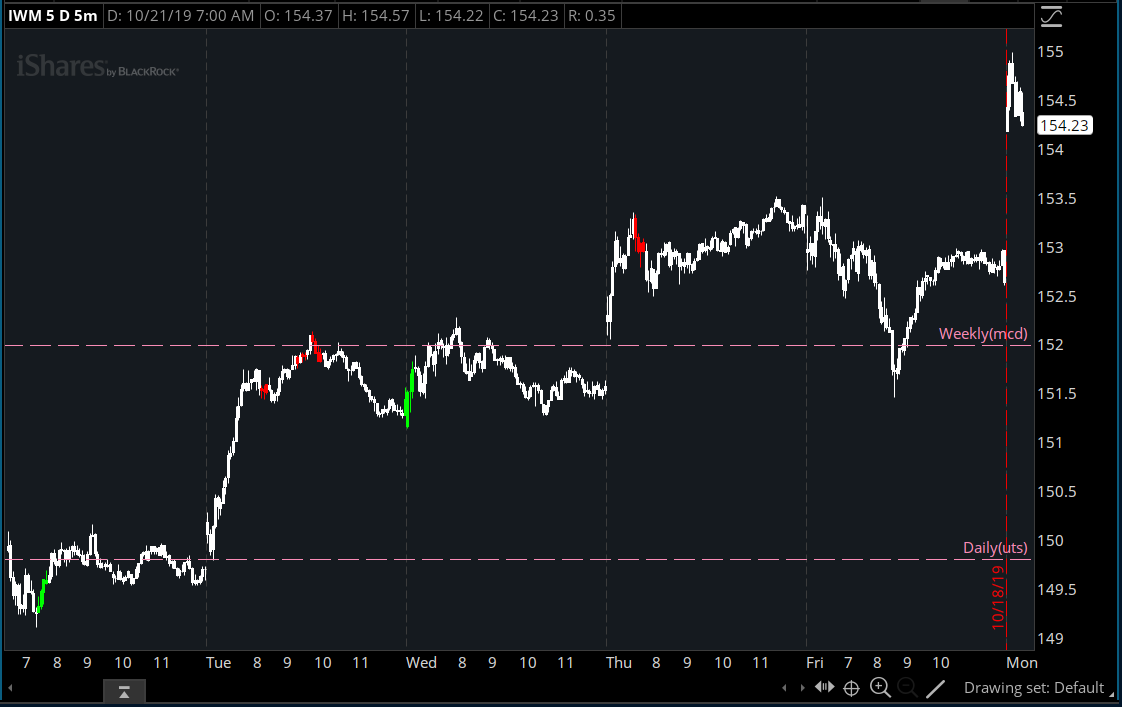
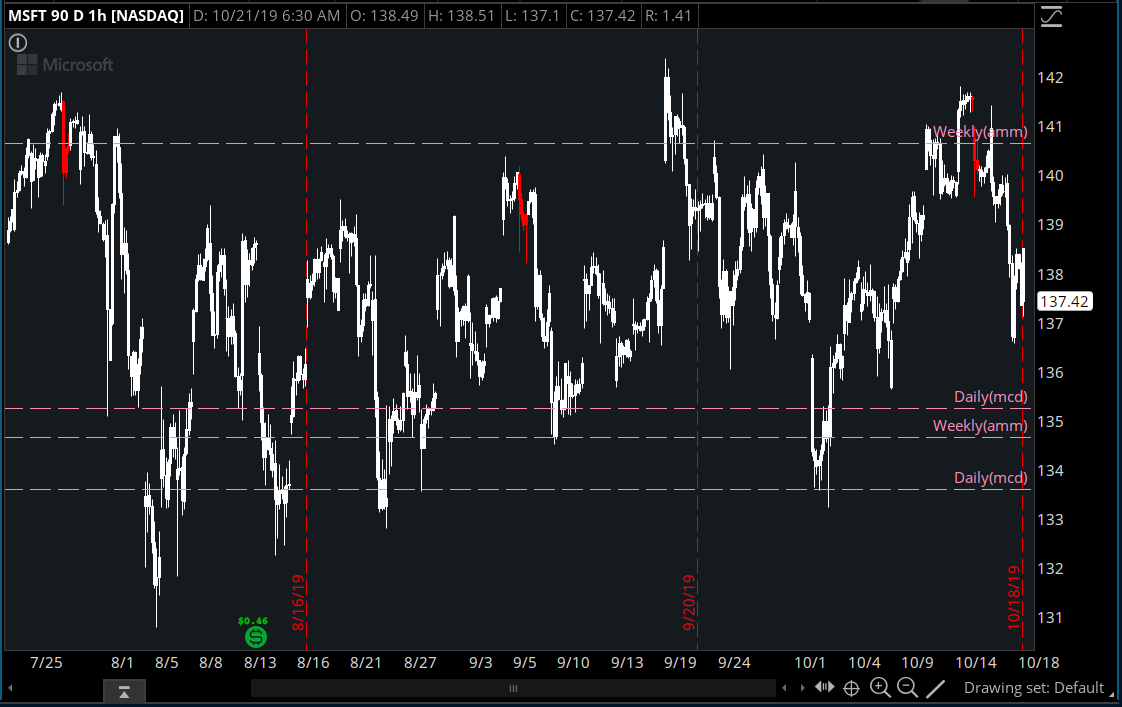
mod note:
Most divergence indicators look amazing in hindsight because they are repainters.
They wait for future pivots, then go back and paint perfect signals on old candles. This one doesn't.
It evaluates only the information available at the current bar, so once a candle closes its signal is locked in. That makes it a much more honest tool for live trading.
For day traders, divergence can be an early clue that momentum is fading before price actually reverses. It won't predict every turn, but it can help identify exhaustion and keep you from chasing moves that are already running out of steam. Used alongside your existing strategy, it adds another piece of context without rewriting history.
thinkScript Code
Code:
# Confirmed Divergence
# Assembled by BenTen at useThinkScript.com
# Converted from https://www.tradingview.com/script/PFsMAjcQ-Confirmed-Divergence/

input rsiprd = 14;
input source = close;
input averageType = AverageType.WILDERS;

def NetChgAvg = MovingAverage(averageType, source - source[1], rsiprd);
def TotChgAvg = MovingAverage(averageType, AbsValue(source - source[1]), rsiprd);
def ChgRatio = if TotChgAvg != 0 then NetChgAvg / TotChgAvg else 0;

def RSI = 50 * (ChgRatio + 1);

input length = 30;
input mult = 2.0;
input src = close;

input ob = 70;
input os = 30;
input lengthAO1 = 5;
input lengthAO2 = 34;
def rv = RSI;

def AO = simpleMovingAvg((high + low) / 2, lengthAO1) - simpleMovingAvg((high + low) / 2, lengthAO2);

input x = 5;
input z = 25;

def srcLL = src > lowest(src, x) and lowest(src, x)<lowest(src, z)[x];

def rsiHL = rv > lowest(rv, x) and lowest(rv, x) > lowest(rv, z)[x] and lowest(rv, z)<os;

def aoHL = AO > lowest(AO, x) and lowest(AO, x) > lowest(AO, z)[x] and lowest(AO, x) < 0;

def BullishDiv = srcLL and rsiHL and aoHL;

def srcHH = src < highest(src, x) and highest(src, x)>highest(src, z)[x];

def rsiLH = rv < highest(rv, x) and highest(rv, x) < highest(rv, z)[x] and highest(rv, z)>ob;

def aoLH = AO < highest(AO, x) and highest(AO, x) < highest(AO, z)[x] and highest(AO, x) > 0;

def BearishDiv = srcHH and rsiLH and aoLH;

def basis = simpleMovingAvg(source, length);
def dev = mult * stdev(source, length);

def upper = basis + dev;
def lower = basis - dev;

assignPriceColor(if BullishDiv then color.green else if BearishDiv then color.red else Color.white);
Attachments
Last edited by a moderator: