Hi Bob,
Thanks for sharing your trading in such detail.
I noted your are big on opening session trading... Please check out my post in the following link
It talk about a trader, Mark Fisher who have way to exploits the opening/daily range. If you YouTube "Mark Fisher ACD", u can find a series where he talk about his method in depth. However, due to old footage, you can't see clearly the slide that he show on he's live teaching... For that, u have to read he's book, "The logical trader". The video, however, teaches how day trader should operate he's routine and I think it compliment the book very well. I think you'll like he's work.
I'm however more of a swing trader and are very interested in your swing chart on the index. I've the following question:
1. I check/uncheck the RL_PlotEntry_PL1 but don't see any label or indicator pop up?
2. Are there any inter-play u r looking at between the index. If not, why set them up in this 3 chart format?
3. Can elaborate more on the "Cyclical factors and chart patterns"
@profitmaya I will post a link later today on the setup I use to day trade stocks. Most recently Microsoft. There is significant info on how to learn daytrading/scalping available on youtube and this forum. Many daytraders, assuming they are really trying to help rather than sell you something, will tell you to focus on markets till you understand them, even if you only focus on one commodity or stock. Understand how price action works by observing over months and risking very, very little (only amounts that you can afford to lose without a sweat) until you get the feel. ie; trade with one stock bought or sold until you can win with some consistency. Don't go for leverage until that point. Consider it a game you pay for while you learn. Secondly, the system you use you must understand. Some, like me, trade from chart info, others like indicators that help decision making (RSI,MACD, and those types at the bottom of the chart) I tend to use none. I watch the one minute price action in relation to what I call Significant Lines.
@Bentley In answer to your questions. 1) I will post the PlotEntry indicator that I am using, which is code from this site and not original to me. I cannot recall where I got it. I modified the original for my own purposes. 2) Yes, obvious interplay between indexes which can be helpful when you decide a direction to play. Based on the direction, you could choose the weaker or stronger index etf. 3) For larger cyclical factors I use a newsletter writer that I have followed for many years and whose system I trust relative to determining valid cyclical information. insiidetracktrading.com
I have no connection to this site and am NOT recommending you subscribe. I am only sharing what I have found valuable. The charts must confirm what the cyclical info points to before I take a swing trade. One comment I would make about the ACD system that I have observed is correct. And that is even if an index ETF is down on a Friday, unless we are in a strong bear on that index, the market will often reward a bull entry held till the open on Monday. That is exactly what happened this morning. QQQ was down Friday. I went long, because it has been a more bullish index ETF, and got out at the open for a nice profit. I am NOT recommending you trade this way unless you clearly understand your risks.
@Visioon Those lines are open and close lines. The code for daily lines above will project the present days close, high, and low into the next day with the exception of the open. To project the open into the next day simply change this line of code from "plot D_Open = open(period = AP);" to "plot D_Open = open(period = AP[1]);" ,without the parentheses.
Here is an image of Fridays bar for NQ futures. It shows the the lines projected into the next day. The plots were changed to be a line, since you are showing what I assume is a one day bar, rather than a dot, which I use on the intraday charts. Code is below the image. If you want to project more then one day, I just draw lines.
@profitmaya I will post a link later today on the setup I use to day trade stocks. Most recently Microsoft. There is significant info on how to learn daytrading/scalping available on youtube and this forum. Many daytraders, assuming they are really trying to help rather than sell you something, will tell you to focus on markets till you understand them, even if you only focus on one commodity or stock. Understand how price action works by observing over months and risking very, very little (only amounts that you can afford to lose without a sweat) until you get the feel. ie; trade with one stock bought or sold until you can win with some consistency. Don't go for leverage until that point. Consider it a game you pay for while you learn. Secondly, the system you use you must understand. Some, like me, trade from chart info, others like indicators that help decision making (RSI,MACD, and those types at the bottom of the chart) I tend to use none. I watch the one minute price action in relation to what I call Significant Lines.
@Bentley In answer to your questions. 1) I will post the PlotEntry indicator that I am using, which is code from this site and not original to me. I cannot recall where I got it. I modified the original for my own purposes. 2) Yes, obvious interplay between indexes which can be helpful when you decide a direction to play. Based on the direction, you could choose the weaker or stronger index etf. 3) For larger cyclical factors I use a newsletter writer that I have followed for many years and whose system I trust relative to determining valid cyclical information. insiidetracktrading.com
I have no connection to this site and am NOT recommending you subscribe. I am only sharing what I have found valuable. The charts must confirm what the cyclical info points to before I take a swing trade. One comment I would make about the ACD system that I have observed is correct. And that is even if an index ETF is down on a Friday, unless we are in a strong bear on that index, the market will often reward a bull entry held till the open on Monday. That is exactly what happened this morning. QQQ was down Friday. I went long, because it has been a more bullish index ETF, and got out at the open for a nice profit. I am NOT recommending you trade this way unless you clearly understand your risks.
@rlohmeyer : thank you. Yes, I have been doing day trading using 50/100/200 EMA on 2 minute time frame. I usually trade SPY/QQQ/BAC. I started learning to daytrade using BAC and its one of my bread and butter. I incorporated your code but not getting the look and feel of the chart that you posted.
@TOS Rookie
PLI simply means "Price Line Increment". When you set that number at say .50, then every major line will be at a $.50 level, such as 38.50 or 40 or 40.50, and the midpoint lines will draw at each .25 level.
Bob
Is there any thumb rule to follow to determine Price Line Increment? Can it be a daily ATR but that may serve purpose of swing trading only. I'm kind of lost on how to set PLI..for eg: I have tried for BAC 0.5 and it works like charm but for other stocks, it does not work. So, would you mind sharing how you determine price line increment value for a ticker? also futures , do we need put a tick?
@Visioon Those lines are open and close lines. The code for daily lines above will project the present days close, high, and low into the next day with the exception of the open. To project the open into the next day simply change this line of code from "plot D_Open = open(period = AP);" to "plot D_Open = open(period = AP[1]);" ,without the parentheses.
Here is an image of Fridays bar for NQ futures. It shows the the lines projected into the next day. The plots were changed to be a line, since you are showing what I assume is a one day bar, rather than a dot, which I use on the intraday charts. Code is below the image. If you want to project more then one day, I just draw lines.
Is there a way I can display the actual values of previous day high/low/open on the lines either right or left? I was able to do as a label, but not able to display on the lines.
Is there any thumb rule to follow to determine Price Line Increment? Can it be a daily ATR but that may serve purpose of swing trading only. I'm kind of lost on how to set PLI..for eg: I have tried for BAC 0.5 and it works like charm but for other stocks, it does not work. So, would you mind sharing how you determine price line increment value for a ticker? also futures , do we need put a tick?
I generally set the major increment at 1 and then based on the price of a particular instrument I set the increment at .5 or .25....stocks will often react to .5, more often to 1 and when you reach a 5 increment stocks will fight over that level. Here is my most recent update. In this one you can also set your vertical lines to show when a 5 minute period ends or a 15 minute period. I just turn off the regular trading grid and use my own exclusively. Here is the most recent PriceTimeGrid link. http://tos.mx/fkwHOzp
Is there a way I can display the actual values of previous day high/low/open on the lines either right or left? I was able to do as a label, but not able to display on the lines.
Here is what I call DayLines. It lets you display Yesterdays Close, Todays Open, Todays Low and High, Yesterdays Low and High, and also it gives me the ability to show these lines not just for a Day but for say a 5 minute bar, which is very useful if I am trading on a 1 minute chart because price will often react to highs and lows of 5 minute bars. http://tos.mx/pbRlOuS
Here is an image of the PriceTimeGrid lines and the DayLines indicators I just posted in Post #69 and #70 above. In this post you can see how price reacted off the Open Line and then continuing up for a move. The strong yellow line is a price level divisible by 5, in this case 445 on the SPY etf. Marking these "5" lines is included in the PriceTime Grid.
You can also see that on this one minute chart I have the Vertical time lines set for 5 minutes and 15 minutes. And the 5 minute time frame shows the tops and bottoms of the 5 minute time frame. This capacity is included in the DayLines indicator.
These 2 indicators are always on my intraday charts.
And just a comment. On SPY for instance, I will generally set my "Major" increment at $.50 and my regular increment at either $.25 or $.50 depending on how volatile the market is. When the market opens it is going to be volatile for 30 minutes to an hour or so, thus 1 minute bars can move $.50 in one or two minutes. So I will trade less shares on the open than at other times.
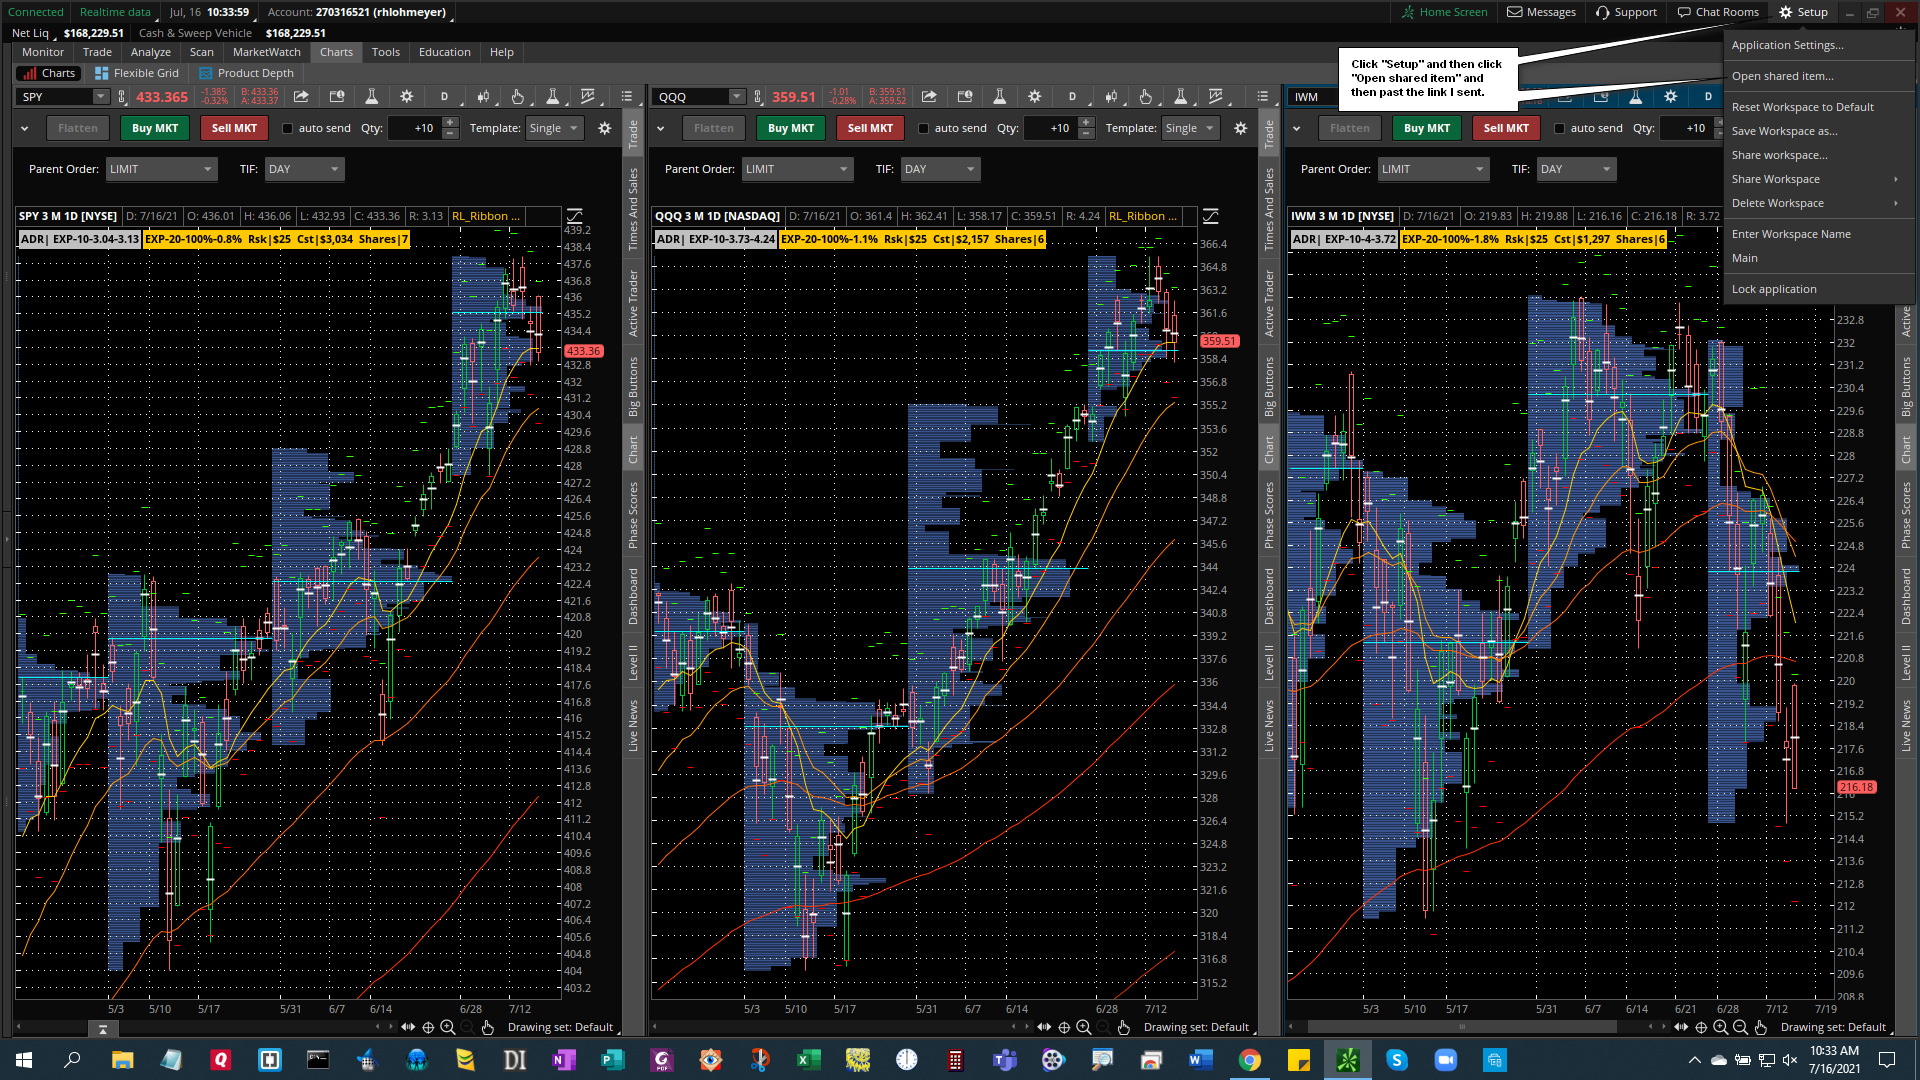
My longer term swing trades are on the major Index ETFs, SPY, QQQ, IWM....I don't trade individual stocks. I time entries based on Cyclical factors and chart patterns. I am in long term on the Spy, and have been shorting the IWM. Here is my setup. Copy this link. Then follow my instructions in the images below.
I set the basic risk level at $25, but trade the number of shares in increments of $25 risks. $50,$100,$200,$500 based on my assessment of the potential for a swing up or down to the target stop or limit.
Last set of indicators I use to day trade the 5min/1min by price/volume action in conjunction with Support/Resistance. Plus commentary on todays action. PS: I only trade High Volume/ High Daily Range Stocks. These stocks supply both high institutional trading interest and high daily range for large tick moves. Also, only stocks that easily allow shorting.
The additional indicators used are:
(1) 2 Volume profiles: 1 for the full days action, and the send to identify volume nodes which are the magenta lines on the chart and are crucial for telling you where the "Center of Gravity" lies in relation to present price action. These are standard with TOS though I have modified versions to get the Gray color instead of the standard blue.
(2) @korygill Last Price Tracker....essential to watch location of present price action
(3) TOS standard VWAP setup as thick dashes (white) on my chart
@Thomas Thanks for the nifty code from post #12 and the suggestion about 2 minute bars, which did help reduce the noise level. The above chart is showing 2 minute bars.
Since I use a 3 bar Volume POC on my trading chart, I use this as a reference point. These high volume nodes often turn out to be close to a pullback area before continuation of a move. It forms a pattern confirming continuation of a move based on actual high volume nodes. Here is an image with the magenta lines being the high volume nodes. I use these in concert with the Price Levels, as stated elsewhere.
I have improved the code for AutoPriceLevels. It now does several things automatically based on the choice of options. The improved code is below.
If you choose to set your own start level price because the stock has gapped in overnight trade, you would choose "yes" for the "gap start" option and a specific round number price level for the "gaplevel" start. The gaplevel start price will show on the chart as a solid orange line, and 8 price levels will populate BOTH ABOVE AND BELOW THAT LEVEL along with midpoints if the "show midpoints" option is "yes".
However, if you choose "no" for the "gap start" option then the code locates the previous day nearest round number close price (regular trading session) and sets that price level as the first Price Level, shown in Orange. It then does the same thing as a above, populates 8 Price Levels above and below.
I am hoping this makes this indicator easier to use. On my chart above I have reduced my background grid so that it does not show so that I can clearly see the major levels.
Code:
#Auto Price Levels
#@rlohmeyer shared on UseThinkscript
input gapStart = no;
input gaplevel = 00;
input PLI = 1.00;
input showMidpoints = yes;

DefineGlobalColor("PLI",color.white);
DefineGlobalColor("MP",color.light_gray);
def cl = close(period = AggregationPeriod.DAY);
def ST = Round(cl[1], 0);
def START = if gapstart == 0 then ST else if gapstart == 1 then gaplevel else Double.NaN;
def MP = PLI/2;

#Plot START
plot PLS = START;
PLS.SetDefaultColor(color.orange);
PLS.HideTitle();
PLS.SetPaintingStrategy(PaintingStrategy.horizontal);

#START Up
plot MUS = if showMidpoints then START + MP else Double.NaN;
MUS.SetDefaultColor(globalColor("MP"));
MUS.HideTitle();
MUS.SetPaintingStrategy(PaintingStrategy.dashes);
MUS.HideBubble();
plot P2 = if START > 0 then START + PLI else Double.NaN;
P2.SetDefaultColor(globalColor("PLI"));
P2.HideTitle();
P2.SetPaintingStrategy(PaintingStrategy.horizontal);
plot M2 = if showMidpoints then P2 + MP else Double.NaN;
M2.SetDefaultColor(globalColor("MP"));
M2.HideTitle();
M2.SetPaintingStrategy(PaintingStrategy.dashes);
M2.HideBubble();
plot P3 = if START > 0 then START + (2 * PLI)else Double.NaN;
P3.SetDefaultColor(globalColor("PLI"));
P3.HideTitle();
P3.SetPaintingStrategy(PaintingStrategy.horizontal);
plot M3 = if showMidpoints then P3 +  MP else Double.NaN;
M3.SetDefaultColor(globalColor("MP"));
M3.HideTitle();
M3.SetPaintingStrategy(PaintingStrategy.dashes);
M3.HideBubble();
plot P4 = if START > 0 then START + (3 * PLI)else Double.NaN;
P4.SetDefaultColor(globalColor("PLI"));
P4.HideTitle();
P4.SetPaintingStrategy(PaintingStrategy.horizontal);
plot M4 = if showMidpoints then P4 + MP else Double.NaN;
M4.SetDefaultColor(globalColor("MP"));
M4.HideTitle();
M4.SetPaintingStrategy(PaintingStrategy.dashes);
M4.HideBubble();
plot P5 = if START > 0 then START + (4 * PLI)else Double.NaN;
P5.SetDefaultColor(globalColor("PLI"));
P5.HideTitle();
P5.SetPaintingStrategy(PaintingStrategy.horizontal);
plot M5 = if showMidpoints then P5 + MP else Double.NaN;
M5.SetDefaultColor(globalColor("MP"));
M5.HideTitle();
M5.SetPaintingStrategy(PaintingStrategy.dashes);
M5.HideBubble();
plot P6 = if START > 0 then START + (5 * PLI)else Double.NaN;
P6.SetDefaultColor(globalColor("PLI"));
P6.HideTitle();
P6.SetPaintingStrategy(PaintingStrategy.horizontal);
plot M6 = if showMidpoints then P6 + MP else Double.NaN;
M6.SetDefaultColor(globalColor("MP"));
M6.HideTitle();
M6.SetPaintingStrategy(PaintingStrategy.dashes);
M6.HideBubble();
plot P7 = if START > 0 then START + (6 * PLI)else Double.NaN;
P7.SetDefaultColor(globalColor("PLI"));
P7.HideTitle();
P7.SetPaintingStrategy(PaintingStrategy.horizontal);
plot M7 = if showMidpoints then P7 + MP else Double.NaN;
M7.SetDefaultColor(globalColor("MP"));
M7.HideTitle();
M7.SetPaintingStrategy(PaintingStrategy.dashes);
M7.HideBubble();
plot P8 = if START > 0 then START + (7 * PLI)else Double.NaN;
P8.SetDefaultColor(globalColor("PLI"));
P8.HideTitle();
P8.SetPaintingStrategy(PaintingStrategy.horizontal);
plot M8 = if showMidpoints then P8 + MP else Double.NaN;
M8.SetDefaultColor(globalColor("MP"));
M8.HideTitle();
M8.SetPaintingStrategy(PaintingStrategy.dashes);
M8.HideBubble();
plot P9 = if START > 0 then START + (8 * PLI)else Double.NaN;
P9.SetDefaultColor(globalColor("PLI"));
P9.HideTitle();
P9.SetPaintingStrategy(PaintingStrategy.horizontal);

#STARTDown
plot MUD = if showMidpoints then START - MP else Double.NaN;
MUD.SetDefaultColor(globalColor("MP"));
MUD.HideTitle();
MUD.SetPaintingStrategy(PaintingStrategy.dashes);
MUD.HideBubble();
plot P10 = if START > 0 then START - PLI else Double.NaN;
P10.SetDefaultColor(globalColor("PLI"));
P10.HideTitle();
P10.SetPaintingStrategy(PaintingStrategy.horizontal);
plot M10 = if showMidpoints then P10 - MP else Double.NaN;
M10.SetDefaultColor(globalColor("MP"));
M10.HideTitle();
M10.SetPaintingStrategy(PaintingStrategy.dashes);
M10.HideBubble();
plot P11 = if START > 0 then START - (2 * PLI) else Double.NaN;
P11.SetDefaultColor(globalColor("PLI"));
P11.HideTitle();
P11.SetPaintingStrategy(PaintingStrategy.horizontal);
plot M11 = if showMidpoints then P11 - MP else Double.NaN;
M11.SetDefaultColor(globalColor("MP"));
M11.HideTitle();
M11.SetPaintingStrategy(PaintingStrategy.dashes);
M11.HideBubble();
plot P12 = if START > 0 then START - (3 * PLI)else Double.NaN;
P12.SetDefaultColor(globalColor("PLI"));
P12.HideTitle();
P12.SetPaintingStrategy(PaintingStrategy.horizontal);
plot M12 = if showMidpoints then P12 - MP else Double.NaN;
M12.SetDefaultColor(globalColor("MP"));
M12.HideTitle();
M12.SetPaintingStrategy(PaintingStrategy.dashes);
M12.HideBubble();
plot P13 = if START > 0 then START - (4 * PLI)else Double.NaN;
P13.SetDefaultColor(globalColor("PLI"));
P13.HideTitle();
P13.SetPaintingStrategy(PaintingStrategy.horizontal);
plot M13 = if showMidpoints then P13 - MP else Double.NaN;
M13.SetDefaultColor(globalColor("MP"));
M13.HideTitle();
M13.SetPaintingStrategy(PaintingStrategy.dashes);
M13.HideBubble();
plot P14 = if START > 0 then START - (5 * PLI)else Double.NaN;
P14.SetDefaultColor(globalColor("PLI"));
P14.HideTitle();
P14.SetPaintingStrategy(PaintingStrategy.horizontal);
plot M14 = if showMidpoints then P14 - MP else Double.NaN;
M14.SetDefaultColor(globalColor("MP"));
M14.HideTitle();
M14.SetPaintingStrategy(PaintingStrategy.dashes);
M14.HideBubble();
plot P15 = if START > 0 then START - (6 * PLI)else Double.NaN;
P15.SetDefaultColor(globalColor("PLI"));
P15.HideTitle();
P15.SetPaintingStrategy(PaintingStrategy.horizontal);
plot M15 = if showMidpoints then P15 - MP else Double.NaN;
M15.SetDefaultColor(globalColor("MP"));
M15.HideTitle();
M15.SetPaintingStrategy(PaintingStrategy.dashes);
M15.HideBubble();
plot P16 = if START > 0 then START - (7 * PLI)else Double.NaN;
P16.SetDefaultColor(globalColor("PLI"));
P16.HideTitle();
P16.SetPaintingStrategy(PaintingStrategy.horizontal);
plot M16 = if showMidpoints then P16 - MP else Double.NaN;
M16.SetDefaultColor(globalColor("MP"));
M16.HideTitle();
M16.SetPaintingStrategy(PaintingStrategy.dashes);
M16.HideBubble();
plot P17 = if START > 0 then START - (8 * PLI)else Double.NaN;
P17.SetDefaultColor(globalColor("PLI"));
P17.HideTitle();
P17.SetPaintingStrategy(PaintingStrategy.horizontal);
@Thomas Are you trading these signals yet, or just watching? I am glad the work I did on this is adding some value. For myself, I am finding the Dot not as helpful as I hoped. I am still using your High/Low warning, but I primarily use the Auto Significant Price levels and secondarily, or in combination with, significant S/R: Open, Close, VWAP, 30 minute POC, to determine entry or exit. What I am finding is that I can be out of the market in 60 to 90 minutes after the open, during the time the initial range is being set. Your High/Low gives me warning of a potential reversal in that morning period at a significant price level. The entry is as near to a break of that price level as possible and get out in full, or in part, by the next price level ($.50), and ride any held position further for a swing trade after the scalp. This stock had quite a day Friday. Average 30 Day Percentage Range was over 8% from the regular session High to Low, but Friday it was over 13%. (Shown in the Label at the top marked by the Cyan Arrows) I caught 3 little waves. 1st marked by RED short entry arrow/Green close arrow. The other 2 marked by Green long entry arrow/Red close arrow. Out before 90 minutes. This type of trading suits me. I am not a patient trader, so I can't hang around and watch. Plus I am older, so must keep moving.
Can you share the code for "Average 30 Day Percentage Range". Also, I'm trying to modify the code to display the actual price of Days High/Days Low on top of the lines so its clear to understand.
In answer to your question in Post # 74, here is the Volume Profile code I presently use. It only shows the Profile and the POC, which is all I use. In order to get a POC for just 5 bars. Simply set your the parameters like you see in the image, which uses 1 minute bars. The code link is below the image.
In answer to your question in Post #75 about how to set the ADR% in the label to a different average, I am sharing the ADR% label I presently use, with the sections you would change in order to get what you want. The link for the label code is beneath the image.
@rlohmeyer Hello sir, I'm referring to your post in Bonbon thread that's no more open for replies, i posted your code and got only arrows on chart, is that the coded for? arrows repaint?
@rlohmeyer Hello sir, I'm referring to your post in Bonbon thread that's no more open for replies, i posted your code and got only arrows on chart, is that the coded for? arrows repaint?
@tem2005
Yes, arrows repaint. That is why this code or any other such code that depends upon identifying high or low bars or zig/zags within a certain number of bars NOT being exceeded must be used with other indicators to prove useful. The hunt for a signaling system such as this was not in the end useful, and was abandoned. I continue to trade with the other indicators listing in this thread, such as Volume Profile POC's, EMA Ribbons, significant day lines, VWAP, and AutoGrid lines.
In the signaling systems I explored, I used the ZigZag indicator, which can be found here in this thread about the Enhanced Trend Reversal Indicator, as well as the one you are referring to utilizing a smoothing system for Heikin Ashi candles based on BonBon's work. I explored these and quite a number of other indicators that would allow me to ONLY watch chart action, rather than lower indicators. However, I did not find any system that allowed better results than simply reading price action in relation to specific significant levels, which is what this thread has been about, in terms of posting indicators that I continue to use. I may at some point update some of these to the versions I am presently using, however, the code is easily modifiable.
@rlohmeyer: Thank you for sharing the level indicator. I have been looking for something like this for a long time. I have couple of questions:
1. What is the significance of yellow line?
2. What is the recommended setting for "Increment" and "Major"
3. What does PD, PU and SMU mean?
useThinkScript is the #1 community of stock market investors using indicators and other tools to power their trading strategies. Traders of all skill levels use our forums to learn about scripting and indicators, help each other, and discover new ways to gain an edge in the markets.
How do I get started?
We get it. Our forum can be intimidating, if not overwhelming. With thousands of topics, tens of thousands of posts, our community has created an incredibly deep knowledge base for stock traders. No one can ever exhaust every resource provided on our site.
If you are new, or just looking for guidance, here are some helpful links to get you started.
VIP members get exclusive access to these proven and tested premium indicators: Buy the Dip, Advanced Market Moves 2.0, Take Profit, and Volatility Trading Range. In addition, VIP members get access to over 50 VIP-only custom indicators, add-ons, and strategies, private VIP-only forums, private Discord channel to discuss trades and strategies in real-time, customer support, trade alerts, and much more. Learn all about VIP membership here.
How can I access the premium indicators?
To access the premium indicators, which are plug and play ready, sign up for VIP membership here.

")