Auto Significant Price Levels for ThinkorSwim

Absolutely perfect setup today for a clear shot at a major target. This shows my scalp charts setup with all the major indicators I use: PriceTime Grid, EMA Ribbon on the daily and Higher Time Frame EMA Ribbon on the 1 minute, Significant Daily Lines, VWAP, Volume Profile set to 15 minute periods and the Daily Volume Profile POC. All you need to scalp. Plus putting in the time to "study" price action in relation to time and volume profile and practice with trading live with 1 stock that has high average daily ranges till you get the hang of it and have a trading plan. With the advantage that you can be out of the market within 2 hours of the open.
GwGof6r.jpg
 
Last edited:
Would you please add prior day candle body high low to the script please because I use this daily and its awesome.
 
@Visioon
Which indicator are you referring to? I use an indicator, code below, which gives me Prior Day High/Low, Prior Day Close, Today's Open, and Today's High/Low. These are primary targets for daily price action.
Code:
#@rlohmeyer_SRLines
# much code borrowed through UseThinkscript
def AP = aggregationPeriod.DAY;

plot D_Open = open(period = AP);
D_Open.SetDefaultColor(Color.YELLOW);
D_Open.SetPaintingStrategy(PaintingStrategy.points);
D_Open.SetLineWeight(2);
D_Open.HideTitle();

plot Y_Close = close(period =AP)[1];
Y_Close.SetPaintingStrategy(PaintingStrategy.squares);
Y_Close.SetDefaultColor(Color.DARK_ORANGE);
Y_Close.SetLineWeight(2);
Y_Close.HideTitle();
Y_Close.HideBubble();

plot D_High = high(period = AP);
D_High.SetDefaultColor(Color.Green);
D_High.SetPaintingStrategy(PaintingStrategy.points);
D_High.SetLineWeight(2);
D_High.HideTitle();
D_High.HideBubble();

plot D_Low = low(period = AP);
D_Low.SetDefaultColor(Color.RED);
D_Low.SetPaintingStrategy(PaintingStrategy.points);
D_Low.SetLineWeight(2);
D_Low.HideTitle();
D_Low.HideBubble();
 
Last edited:
@tradeidea20
Which indicator are you referring to? I use an indicator, code below, which gives me Prior Day High/Low, Prior Day Close, Today's Open, and Today's High/Low. These are primary targets for daily price action.
Code:
#@rlohmeyer_SRLines
# much code borrowed through UseThinkscript
def AP = aggregationPeriod.DAY;

plot D_Open = open(period = AP);
D_Open.SetDefaultColor(Color.YELLOW);
D_Open.SetPaintingStrategy(PaintingStrategy.points);
D_Open.SetLineWeight(2);
D_Open.HideTitle();

plot Y_Close = close(period =AP)[1];
Y_Close.SetPaintingStrategy(PaintingStrategy.squares);
Y_Close.SetDefaultColor(Color.DARK_ORANGE);
Y_Close.SetLineWeight(2);
Y_Close.HideTitle();
Y_Close.HideBubble();

plot D_High = high(period = AP);
D_High.SetDefaultColor(Color.Green);
D_High.SetPaintingStrategy(PaintingStrategy.points);
D_High.SetLineWeight(2);
D_High.HideTitle();
D_High.HideBubble();

plot D_Low = low(period = AP);
D_Low.SetDefaultColor(Color.RED);
D_Low.SetPaintingStrategy(PaintingStrategy.points);
D_Low.SetLineWeight(2);
D_Low.HideTitle();
D_Low.HideBubble();
The indicator that draws those levels for TOS.
 
@Visioon Those lines are open and close lines. The code for daily lines above will project the present days close, high, and low into the next day with the exception of the open. To project the open into the next day simply change this line of code from "plot D_Open = open(period = AP);" to "plot D_Open = open(period = AP[1]);" ,without the parentheses.
Here is an image of Fridays bar for NQ futures. It shows the the lines projected into the next day. The plots were changed to be a line, since you are showing what I assume is a one day bar, rather than a dot, which I use on the intraday charts. Code is below the image. If you want to project more then one day, I just draw lines.
KT9ZZut.jpg


Code:
#@rlohmeyer_SRLines
# much code borrowed through UseThinkscript
def AP = aggregationPeriod.DAY;

plot D_Open = open(period = AP)[1];
D_Open.SetDefaultColor(Color.YELLOW);
D_Open.SetPaintingStrategy(PaintingStrategy.points);
D_Open.SetLineWeight(2);
D_Open.HideTitle();

plot Y_Close = close(period =AP)[1];
Y_Close.SetPaintingStrategy(PaintingStrategy.squares);
Y_Close.SetDefaultColor(Color.DARK_ORANGE);
Y_Close.SetLineWeight(2);
Y_Close.HideTitle();
Y_Close.HideBubble();

plot D_High = high(period = AP);
D_High.SetDefaultColor(Color.Green);
D_High.SetPaintingStrategy(PaintingStrategy.points);
D_High.SetLineWeight(2);
D_High.HideTitle();
D_High.HideBubble();

plot D_Low = low(period = AP);
D_Low.SetDefaultColor(Color.RED);
D_Low.SetPaintingStrategy(PaintingStrategy.points);
D_Low.SetLineWeight(2);
D_Low.HideTitle();
D_Low.HideBubble();

plot Y_High = high(period = AP)[1];
Y_High.SetDefaultColor(Color.GREEN);
Y_High.SetPaintingStrategy(PaintingStrategy.squares);
Y_High.SetLineWeight(2);
Y_High.HideTitle();
Y_High.HideBubble();

plot Y_Low =Low(period = AP)[1];
Y_Low.SetDefaultColor(Color.RED);
Y_Low.SetPaintingStrategy(PaintingStrategy.squares);
Y_Low.SetLineWeight(2);
Y_Low.HideTitle();
Y_Low.HideBubble();
Perfect. thank you.
 
I had a couple questions about auto price levels and using volume profile if your available? I love the indicator keep up the good work.
 
@Steakeater
What are your questions? Be glad to help if I can.

Bob
Watching the daily volume profile grow during the day I have noticed that I cant seem to trade the edges because I am not sure where the edges are until after price is done moving. so instead of trading edges I wait for price to go back to the middle of a high volume node for a bounce off and back in the opposite direction. However when doing so I struggle to set me stop loss and where to put it and sometimes price will pass through the high volume node. that has forming how do you differentiate between when its going to pass through or bounce off? I was hoping you could talk more about your methodology regarding scalping using the daily and 30 or 15 min volume profile along with your auto significant price levels.
 
@Steakeater
Here is what I have learned about day trading for best results: (for myself, you will have to develop your own style)

1. Trading just certain levels, like significant price levels or the edges of volume profile, will get you killed. You must watch price action as it is forming and creating its own levels. Specifically 5 minute bars. I found trading lower time frames than 5 minutes creates overtrading. The tops and bottoms of 5 minute bars form their own patterns, and if you watch these forming, you will notice that price will often reject the tops and bottoms of 5 minute bars, especially as they group near a significant level. Big traders and their algorithm's are sensitive to the 5 minute time frame. Price action must confirm the sensitivity of a specific level, rather than expect a significant level, such as a price level, to be sensitive on its own.

2. Understand how certain times tend to be better for trading. I tend to trade after the 1st half hour, and leave after about 2 hours. The first half hour can be seen as the initial range setting. It can be straight up or down, but this is never guaranteed. After 2.5 hours in the morning can be seen as the mid-day period when the big trading houses are lunching, etc, and price action can be less volatile and get choppy. Afternoon about 1.5 to 1 hours prior to close, you can start get more volatile price action, though I tend to not trade that period. AM is it for me. Also understand that the start of each new 15 minute period you can get increased volatility, as there are many 15 minute and 30 minute traders.

3. You need to plan each trade, even if you only trade twice during a 2 hour period. Watch price action near certain levels to determine the sensitivity of the level to rejection. Then set a trade near one of these levels as price action nears it. This will allow you to set a very specific stop level that gives you a very precise risk. You must control your risk precisely, rather than worrying about your potential reward. And the potential REASONABLE reward based on your risk should be 2 times your risk. AND NEVER CHASE A TRADE. IF YOU MISSED IT, JUST WAIT FOR THE NEXT OPPORTUNITY.

4. If you are learning day trading, you must put in the screen time to understand price action. And this means not "needing" to earn money from it. The more psychological pressure you have with "needing" to win, sets the psyche up for failure. This means never risking more than you can "happily" lose and stay in the game.

Day trading is more of a game for me. Others on this forum are professional at some level, and you will notice they end up setting specific, simple rules based systems that they follow. I swing trade the day time frame over weeks or even months for bread and butter trades.

Hope this helps.

Bob
It helps a lot, I would love to hear about longer term swing trading and Thanks for taking the time to reply and help me out.
 
@Steakeater

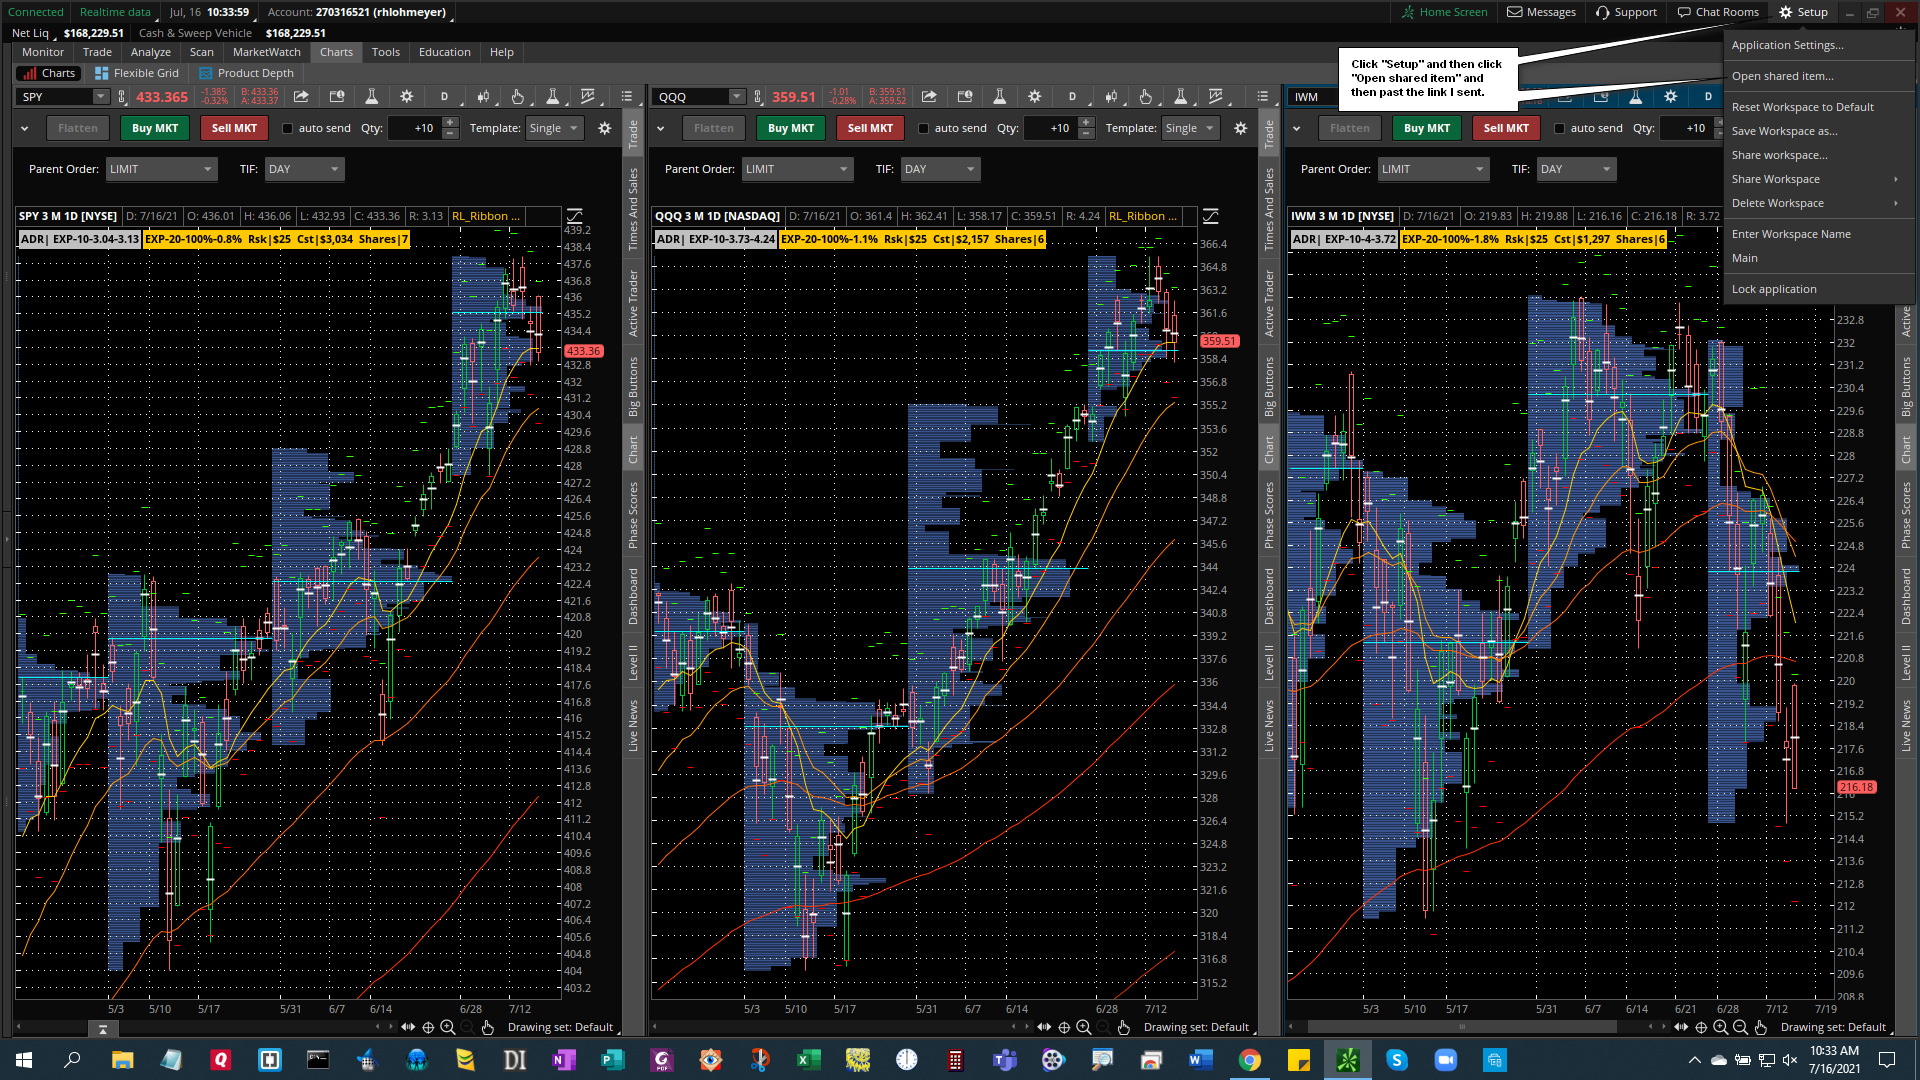
My longer term swing trades are on the major Index ETFs, SPY, QQQ, IWM....I don't trade individual stocks. I time entries based on Cyclical factors and chart patterns. I am in long term on the Spy, and have been shorting the IWM. Here is my setup. Copy this link. Then follow my instructions in the images below.

http://tos.mx/9pOK4BO

VzDyOoE.jpg


dlX0CFn.jpg


I set the basic risk level at $25, but trade the number of shares in increments of $25 risks. $50,$100,$200,$500 based on my assessment of the potential for a swing up or down to the target stop or limit.

Bob
This interesting Bob - Are u following the Strat or Inside Bar? The label idetifying risk etc. ? How did u create that? I was originally looking for something like that. Trading View has a nice set up for 1 to 1 or 2 to 1 etc.
 
@stone

Hi,

The indicator, which I call ATR_RiskControl, is based on calculating stop levels, for either a short play or a long play, by a percentage Average True Range distance, in ticks (coded as $.01), from the present price level. It then calculates how many shares you should short or buy long for your chosen dollar risk level. The stops shown on the cart gives an immediate visual reference for your dollar risk level based on entering a position with the calculated number of shares. It clearly helps to manage risk pretty precisely.

Here is the link to import the indicator for your use:
http://tos.mx/dY3D2es

Bob
Thank you
 

Join useThinkScript to post your question to a community of 21,000+ developers and traders.

Similar threads

Not the exact question you're looking for?

Start a new thread and receive assistance from our community.

87k+ Posts
443 Online
Create Post

Similar threads

Similar threads

The Market Trading Game Changer

Join 2,500+ subscribers inside the useThinkScript VIP Membership Club
  • Exclusive indicators
  • Proven strategies & setups
  • Private Discord community
  • ‘Buy The Dip’ signal alerts
  • Exclusive members-only content
  • Add-ons and resources
  • 1 full year of unlimited support

Frequently Asked Questions

What is useThinkScript?

useThinkScript is the #1 community of stock market investors using indicators and other tools to power their trading strategies. Traders of all skill levels use our forums to learn about scripting and indicators, help each other, and discover new ways to gain an edge in the markets.

How do I get started?

We get it. Our forum can be intimidating, if not overwhelming. With thousands of topics, tens of thousands of posts, our community has created an incredibly deep knowledge base for stock traders. No one can ever exhaust every resource provided on our site.

If you are new, or just looking for guidance, here are some helpful links to get you started.

What are the benefits of VIP Membership?
VIP members get exclusive access to these proven and tested premium indicators: Buy the Dip, Advanced Market Moves 2.0, Take Profit, and Volatility Trading Range. In addition, VIP members get access to over 50 VIP-only custom indicators, add-ons, and strategies, private VIP-only forums, private Discord channel to discuss trades and strategies in real-time, customer support, trade alerts, and much more. Learn all about VIP membership here.
How can I access the premium indicators?
To access the premium indicators, which are plug and play ready, sign up for VIP membership here.
Back
Top