Anchored VWAP Indicator for ThinkorSwim

Quartly Interval for VWAP- Help PLEASE!! I have this I found online, Can't wrap my head around adding a quarterly timeframe

Code:
input timeFrame = {default Day, Week, Month, Year, Minute, Hour, Chart, "Opt Exp", Bar};
input BandType = {default Standard, "1/4 Day Range", "3x Avg Bar Range", ThinkScripter, None};
input ShowCloud = yes;
input HideSdLines = no;

def cap = GetAggregationPeriod();
def errorInAggregation =
    timeFrame == timeFrame.Day and cap >= AggregationPeriod.WEEK or
    timeFrame == timeFrame.Week and cap >= AggregationPeriod.MONTH;
Assert(!errorInAggregation, "timeFrame should be not less than current chart aggregation period");

def yyyyMmDd = GetYYYYMMDD();
def seconds = SecondsFromTime(0);
def month = GetYear() * 12 + GetMonth();
def year = GetYear();
def day_number = DaysFromDate(First(yyyyMmDd)) + GetDayOfWeek(First(yyyyMmDd));
def dom = GetDayOfMonth(yyyyMmDd);
def dow = GetDayOfWeek(yyyyMmDd - dom + 1);
def expthismonth = (if dow > 5 then 27 else 20) - dow;
def exp_opt = month + (dom > expthismonth);
def periodIndx;

switch (timeFrame) {
case Chart:
    periodIndx = 0;

case Minute:
    periodIndx = Floor(seconds / 60 + day_number * 24 * 60);

case Hour:
    periodIndx = Floor(seconds / 3600 + day_number * 24);

case Day:
    periodIndx = CountTradingDays(Min(First(yyyyMmDd), yyyyMmDd), yyyyMmDd) - 1;

case Week:
    periodIndx = Floor(day_number / 7);

case Month:
    periodIndx = Floor(month - First(month));

case Year:
    periodIndx = Floor(year - First(year));

case "Opt Exp":
    periodIndx = exp_opt - First(exp_opt);

case Bar:
    periodIndx = BarNumber() - 1;
}
def isPeriodRolled = CompoundValue(1, periodIndx != periodIndx[1], yes);

def volumeSum;
def volumeVwapSum;
def volumeVwap2Sum;

if (isPeriodRolled) {
    volumeSum = volume;
    volumeVwapSum = volume * vwap;
    volumeVwap2Sum = volume * Sqr(vwap);
} else {
    volumeSum = compoundValue(1, volumeSum[1] + volume, volume);
    volumeVwapSum = compoundValue(1, volumeVwapSum[1] + volume * vwap, volume * vwap);
    volumeVwap2Sum = compoundValue(1, volumeVwap2Sum[1] + volume * Sqr(vwap), volume * Sqr(vwap));
}
def price = volumeVwapSum / volumeSum;

def deviation;
switch (BandType) {

case Standard:
    deviation = Sqrt(Max(volumeVwap2Sum / volumeSum - Sqr(price), 0));

case "1/4 Day Range":
    deviation = Sqrt(AbsValue(high(Period = timeFrame) - low(Period = timeFrame)) * .25);

case "3x Avg Bar Range":
    deviation = Sqrt(Average(TrueRange(high,  close,  low),  20) * 3);

case ThinkScripter:
    deviation = Sqrt(TotalSum(Sqr(((open + high + low + close) / 4) - price) * volume) / TotalSum(volume));

case None:
    deviation = Double.NaN;
}

plot VWAP = price;
VWAP.SetDefaultColor(CreateColor(40, 40, 40));
                
VWAP.SetStyle(Curve.SHORT_DASH);
VWAP.SetLineWeight(2);

# TS_CHART_VWAP_SD_BANDS
# [URL]http://www.thinkscripter.com[/URL]
# [EMAIL][email protected][/EMAIL]
# Last Update 03 APR 2010

input VWAPStdev1 = 0.5;
input VWAPStdev2 = 1.0;
input VWAPStdev3 = 1.5;
input VWAPStDev4 = 2.0;

plot r1 = VWAP + VWAPStdev1 * deviation;
plot s1 = VWAP - VWAPStdev1 * deviation;
plot r2 = VWAP + VWAPStdev2 * deviation;
plot s2 = VWAP - VWAPStdev2 * deviation;
plot r3 = VWAP + VWAPStdev3 * deviation;
plot s3 = VWAP - VWAPStdev3 * deviation;
plot r4 = VWAP + VWAPStdev4 * deviation;
plot s4 = VWAP - VWAPStdev4 * deviation;

DefineGlobalColor("sDev1", (CreateColor(70, 70, 70)));
DefineGlobalColor("sDev2", (CreateColor(128, 128, 128)));
DefineGlobalColor("sDev3", (CreateColor(100, 100, 100)));
DefineGlobalColor("sDev4", (CreateColor(100, 100, 100)));


r1.SetDefaultColor(GlobalColor("sDev1"));
s1.SetDefaultColor(GlobalColor("sDev1"));
r2.SetDefaultColor(GlobalColor("sDev2"));
s2.SetDefaultColor(GlobalColor("sDev2"));
r3.SetDefaultColor(GlobalColor("sDev2"));
s3.SetDefaultColor(GlobalColor("sDev2"));
r4.SetDefaultColor(Color.DOWNTICK);
s4.SetDefaultColor(Color.UPTICK);


r1.SetStyle(Curve.SHORT_DASH);
r2.SetStyle(Curve.SHORT_DASH);
r3.SetStyle(Curve.SHORT_DASH);
r4.SetStyle(Curve.SHORT_DASH);
s1.SetStyle(Curve.SHORT_DASH);
s2.SetStyle(Curve.SHORT_DASH);
s3.SetStyle(Curve.SHORT_DASH);
s4.SetStyle(Curve.SHORT_DASH);


VWAP.HideBubble();
r1.HideBubble();
r2.HideBubble();
r3.HideBubble();
r4.HideBubble();
s1.HideBubble();
s2.HideBubble();
s3.HideBubble();
s4.HideBubble();

r1.SetHiding(HideSdLines);
r2.SetHiding(HideSdLines);
r3.SetHiding(HideSdLines);
r4.SetHiding(HideSdLines);
s1.SetHiding(HideSdLines);
s2.SetHiding(HideSdLines);
s3.SetHiding(HideSdLines);
s4.SetHiding(HideSdLines);


#AddCloud(VWAP, r1, GlobalColor("sDev3"), GlobalColor("sDev3"));
#AddCloud(VWAP, s1, GlobalColor("sDev3"), GlobalColor("sDev3"));
AddCloud(VWAP, r2, GlobalColor("sDev1"), GlobalColor("sDev1"));
AddCloud(VWAP, s2, GlobalColor("sDev1"), GlobalColor("sDev1"));
 

Join useThinkScript to post your question to a community of 21,000+ developers and traders.

Quartly Interval for VWAP- Help PLEASE!! I have this I found online, Can't wrap my head around adding a quarterly timeframe
See if this helps

Code:
input timeFrame = {default Day, Week, Month, Quarter, Year, Minute, Hour, Chart, "Opt Exp", Bar};
input BandType = {default Standard, "1/4 Day Range", "3x Avg Bar Range", ThinkScripter, None};
input ShowCloud = yes;
input HideSdLines = no;

def cap = GetAggregationPeriod();
def errorInAggregation =
    timeFrame == timeFrame.Day and cap >= AggregationPeriod.WEEK or
    timeFrame == timeFrame.Week and cap >= AggregationPeriod.MONTH;
Assert(!errorInAggregation, "timeFrame should be not less than current chart aggregation period");

def yyyyMmDd = GetYYYYMMDD();
def seconds = SecondsFromTime(0);
def month = GetYear() * 12 + GetMonth();
def year = GetYear();
def day_number = DaysFromDate(First(yyyyMmDd)) + GetDayOfWeek(First(yyyyMmDd));
def dom = GetDayOfMonth(yyyyMmDd);
def dow = GetDayOfWeek(yyyyMmDd - dom + 1);
def expthismonth = (if dow > 5 then 27 else 20) - dow;
def exp_opt = month + (dom > expthismonth);
def periodIndx;
def qtr =(GetMonth() - 1) % 3;
switch (timeFrame) {
case Chart:
    periodIndx = 0;

case Minute:
    periodIndx = Floor(seconds / 60 + day_number * 24 * 60);

case Hour:
    periodIndx = Floor(seconds / 3600 + day_number * 24);

case Day:
    periodIndx = CountTradingDays(Min(First(yyyyMmDd), yyyyMmDd), yyyyMmDd) - 1;

case Week:
    periodIndx = Floor(day_number / 7);

case Month:
    periodIndx = Floor(month - First(month));

case Year:
    periodIndx = Floor(year - First(year));

case Quarter:

    periodIndx = qtr == 0 and qtr[1] != 0;

case "Opt Exp":
    periodIndx = exp_opt - First(exp_opt);

case Bar:
    periodIndx = BarNumber() - 1;
}
def isPeriodRolled = CompoundValue(1, periodIndx != periodIndx[1], yes);

def volumeSum;
def volumeVwapSum;
def volumeVwap2Sum;

if (isPeriodRolled) {
    volumeSum = volume;
    volumeVwapSum = volume * vwap;
    volumeVwap2Sum = volume * Sqr(vwap);
} else {
    volumeSum = compoundValue(1, volumeSum[1] + volume, volume);
    volumeVwapSum = compoundValue(1, volumeVwapSum[1] + volume * vwap, volume * vwap);
    volumeVwap2Sum = compoundValue(1, volumeVwap2Sum[1] + volume * Sqr(vwap), volume * Sqr(vwap));
}
def price = volumeVwapSum / volumeSum;

def deviation;
switch (BandType) {

case Standard:
    deviation = Sqrt(Max(volumeVwap2Sum / volumeSum - Sqr(price), 0));

case "1/4 Day Range":
    deviation = Sqrt(AbsValue(high(Period = timeFrame) - low(Period = timeFrame)) * .25);

case "3x Avg Bar Range":
    deviation = Sqrt(Average(TrueRange(high,  close,  low),  20) * 3);

case ThinkScripter:
    deviation = Sqrt(TotalSum(Sqr(((open + high + low + close) / 4) - price) * volume) / TotalSum(volume));

case None:
    deviation = Double.NaN;
}

plot VWAP = price;
VWAP.SetDefaultColor(CreateColor(40, 40, 40));
                
VWAP.SetStyle(Curve.SHORT_DASH);
VWAP.SetLineWeight(2);

# TS_CHART_VWAP_SD_BANDS
# [URL]http://www.thinkscripter.com[/URL]
# [EMAIL][email protected][/EMAIL]
# Last Update 03 APR 2010

input VWAPStdev1 = 0.5;
input VWAPStdev2 = 1.0;
input VWAPStdev3 = 1.5;
input VWAPStDev4 = 2.0;

plot r1 = VWAP + VWAPStdev1 * deviation;
plot s1 = VWAP - VWAPStdev1 * deviation;
plot r2 = VWAP + VWAPStdev2 * deviation;
plot s2 = VWAP - VWAPStdev2 * deviation;
plot r3 = VWAP + VWAPStdev3 * deviation;
plot s3 = VWAP - VWAPStdev3 * deviation;
plot r4 = VWAP + VWAPStdev4 * deviation;
plot s4 = VWAP - VWAPStdev4 * deviation;

DefineGlobalColor("sDev1", (CreateColor(70, 70, 70)));
DefineGlobalColor("sDev2", (CreateColor(128, 128, 128)));
DefineGlobalColor("sDev3", (CreateColor(100, 100, 100)));
DefineGlobalColor("sDev4", (CreateColor(100, 100, 100)));


r1.SetDefaultColor(GlobalColor("sDev1"));
s1.SetDefaultColor(GlobalColor("sDev1"));
r2.SetDefaultColor(GlobalColor("sDev2"));
s2.SetDefaultColor(GlobalColor("sDev2"));
r3.SetDefaultColor(GlobalColor("sDev2"));
s3.SetDefaultColor(GlobalColor("sDev2"));
r4.SetDefaultColor(Color.DOWNTICK);
s4.SetDefaultColor(Color.UPTICK);


r1.SetStyle(Curve.SHORT_DASH);
r2.SetStyle(Curve.SHORT_DASH);
r3.SetStyle(Curve.SHORT_DASH);
r4.SetStyle(Curve.SHORT_DASH);
s1.SetStyle(Curve.SHORT_DASH);
s2.SetStyle(Curve.SHORT_DASH);
s3.SetStyle(Curve.SHORT_DASH);
s4.SetStyle(Curve.SHORT_DASH);


VWAP.HideBubble();
r1.HideBubble();
r2.HideBubble();
r3.HideBubble();
r4.HideBubble();
s1.HideBubble();
s2.HideBubble();
s3.HideBubble();
s4.HideBubble();

r1.SetHiding(HideSdLines);
r2.SetHiding(HideSdLines);
r3.SetHiding(HideSdLines);
r4.SetHiding(HideSdLines);
s1.SetHiding(HideSdLines);
s2.SetHiding(HideSdLines);
s3.SetHiding(HideSdLines);
s4.SetHiding(HideSdLines);


#AddCloud(VWAP, r1, GlobalColor("sDev3"), GlobalColor("sDev3"));
#AddCloud(VWAP, s1, GlobalColor("sDev3"), GlobalColor("sDev3"));
AddCloud(VWAP, r2, GlobalColor("sDev1"), GlobalColor("sDev1"));
AddCloud(VWAP, s2, GlobalColor("sDev1"), GlobalColor("sDev1"));
 
@BenTen Thank you for sharing these scripts! I am trying to make that VWAP Anchored_v02 starts only from today, market open 930 AND that it plots only one line on the Highest high. Meaning I don't want to have a plot every swing high, just from the highest high.
I tried to understand the code and work around it myself but I guess I am too much of a bone head to do that. Any help would be appreciated!

this is the only code I need from the whole thing, just need to add these two things to it.

Code:
input n = 100;
input ticks = 2.0;

def bnOK = barNumber() > n;
def isHigher = fold i = 1 to n + 1 with p = 1
               while p do high > GetValue(high, -i);

def HH = if bnOK and isHigher
         and high == Highest(high, n)
         then high else Double.NaN;

def PivH = if HH > 0 then HH else Double.NaN;

plot Dn = !isNaN(PivH);

def LocH = (high + (tickSize() * ticks)) * volume;

rec PH;
rec VH;
rec PH2;
rec VH2;

if Dn {
    PH = LocH;
    VH = volume;
    PH2 = PH[1];
    VH2 = VH[1];
} else {
    PH = compoundValue(1, LocH + PH[1], Double.NaN);
    VH = compoundValue(1, volume + VH[1], Double.NaN);
    PH2 = compoundValue(1, LocH + PH2[1], Double.NaN);
    VH2 = compoundValue(1, volume + VH2[1], Double.NaN);
}

plot VwapH = if Dn then Double.NaN else PH / VH;

VwapH.SetDefaultColor(Color.DARK_RED);
VwapH.HideBubble();
 
Last edited:
@BenTen Thank you for sharing these scripts! I am trying to make that VWAP Anchored_v02 starts only from today, market open 930 AND that it plots only one line on the Highest high. Meaning I don't want to have a plot every swing high, just from the highest high.
I tried to understand the code and work around it myself but I guess I am too much of a bone head to do that. Any help would be appreciated!

this is the only code I need from the whole thing, just need to add these two things to it.

See if this works as you wanted it:

Code:
input ticks = 2.0;

def HH = if GetDay() == GetLastDay() and high == (high(period = AggregationPeriod.DAY))
         then high else Double.NaN;

def PivH = if HH > 0 then HH else Double.NaN;

plot Dn = !IsNaN(PivH);

def LocH = (high + (TickSize() * ticks)) * volume;

rec PH;
rec VH;
rec PH2;
rec VH2;

if Dn {
    PH = LocH;
    VH = volume;
    PH2 = PH[1];
    VH2 = VH[1];
} else {
    PH = CompoundValue(1, LocH + PH[1], Double.NaN);
    VH = CompoundValue(1, volume + VH[1], Double.NaN);
    PH2 = CompoundValue(1, LocH + PH2[1], Double.NaN);
    VH2 = CompoundValue(1, volume + VH2[1], Double.NaN);
}

plot VwapH = if Dn then Double.NaN else PH / VH;

VwapH.SetDefaultColor(Color.DARK_RED);
VwapH.SetLineWeight(3);
VwapH.HideBubble();
 
Is it possible to have a yearly VWAP or a VWAP that is calculated by the entire history of the stock?

In reality that wouldn't be very helpful and would be very taxing on the TOS servers where the calculations would need to be done... What timeframe are you thinking, D, 4h, 1h, 15m, 5m, other...??? If the code has to recalculate VWAP back an entire year or the stocks total history of available data after virtually every price change of the candle there would be a lot of lag and burden on the servers... I just don't see it as a viable solution from a practicality standpoint... Only a very small portion of overall calculations are done on your local device... The more we tax the servers the more we'll all be complaining about how slow our systems are running... We should be optimizing to reduce the strain, not making every effort to increase the strain... I hope this makes sense as I am seeing it from a systems development viewpoint because I've coded more than a bit of multiuser software over the years... Not to mention the fact that this is not the intention of VWAP...
 
Is it possible to have a yearly VWAP or a VWAP that is calculated by the entire history of the stock?

VWAP is intended to be looked at on a intraday basis, no fund manager or algo is looking at vwap data from a year ago. However you can try and accomplish this feat and you can be the lone wolf. Precaution though ...Lone wolves tend to not survive too long.


( Reference: https://www.investopedia.com/articles/trading/11/trading-with-vwap-mvwap.asp )
  • VWAP is the average price a security has traded at throughout the day, based on both volume and price.
 
VWAP is intended to be looked at on a intraday basis, no fund manager or algo is looking at vwap data from a year ago. However you can try and accomplish this feat and you can be the lone wolf. Precaution though ...Lone wolves tend to not survive too long.


( Reference: https://www.investopedia.com/articles/trading/11/trading-with-vwap-mvwap.asp )
  • VWAP is the average price a security has traded at throughout the day, based on both volume and p
vwap is not only used intraday, vwap is used all the time, i use the 5 day, monthly and 6 month vwap.
 
vwap is not only used intraday, vwap is used all the time, i use the 5 day, monthly and 6 month vwap.
i didn't say "only used".... i said "intended" ... a potato peeler is "intended" to peel a potato, but i'm sure you can peel a carrot. Its ok to be different, difference is what makes the world go round. In this game ide rather personally be looking at the similar price level most people including fund managers and algos are looking at and not be looking at price level that only a few people are looking at, however im sure there are a few that can go against the grain and be successful, i however like to play the odds in my favor . To each their own.
 
i didn't say "only used".... i said "intended" ... a potato peeler is "intended" to peel a potato, but i'm sure you can peel a carrot. Its ok to be different, difference is what makes the world go round. In this game ide rather personally be looking at the similar price level most people including fund managers and algos are looking at and not be looking at price level that only a few people are looking at, however im sure there are a few that can go against the grain and be successful, i however like to play the odds in my favor . To each their own.
I dont think its really intended for intraday. Understanding that vwap is more powerful than any moving average is key, vwap is the market is the closest thing you can get to real price, i
i didn't say "only used".... i said "intended" ... a potato peeler is "intended" to peel a potato, but i'm sure you can peel a carrot. Its ok to be different, difference is what makes the world go round. In this game ide rather personally be looking at the similar price level most people including fund managers and algos are looking at and not be looking at price level that only a few people are looking at, however im sure there are a few that can go against the grain and be successful, i however like to play the odds in my favor . To each their own.
I understnad, my point is that traders like myself that use vwap don't really see it as a tool, they see vwap as the market itself, I learned about this concept a while back and I been studying vwap for a while, you need to look at vwap, on multiple distances, from the present moment, a 21 period vwap is more important than a 21 moving average, a 3 day vwap or a 10 day vwap will tell you things, I try to share alot on here but there's so many "secrets" on vwap that is amazing, another one of my points is that vwap should be thought as the average of a stock, i have found that if something works you share it, but if something works extremely great people won't share it online, vwap was developed in 1984 and the fact that most brokers only give you the daily vwap, the daily average of the stock, the daily market value limits you, limits your thinking, im sorry of I misunderstood you, i will give one resource, look up midas trading system, its quiet amazin really, it might trigger some ideas, ibeen torned for a whileabout sharing the secrets i learned about vwap because noone seems to post things that really help, most indicators dont really help, people horde their ideas, I guess they have their reasons, however I dont want to misguide some new user and direct him to find his own secrets, therefore I will say the vwap=the market.
 
Last edited:
I'm not here to argue what is considered a solid FACT:
VWAP's intended and defined use as per the Securities Exchange Commission, Wikipedia, Fidelity, Investopedia, and in the general GLOBAL trading profession is defined as being intended to be typically (commonly) used on a intraday basis. (that's a FACT) you can look it up.

Like i said to each their own, if someone wants to use it to count the volume weighted average price of carrots to potatoes over the last few years they have every right to. I'm not saying their statistical datapoint is non profitable.
I stand by my original statement of ide rather be looking at the same price levels that fund managers and algos are looking at rather than a price level that almost no one is really looking at.
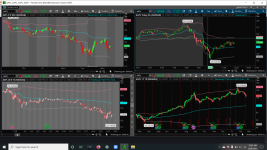
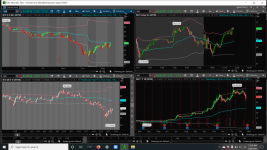
Vwap is not just a tool, that definition is wrong. look at this, this is the 5 day, one day, one month, and one year vwap, wih 2 std deviation, i dont think people understand what vwap really is man.
ltSpaCh.png
4tMedJa.png
zrN1i5W.png
 

Attachments

  • ltSpaCh.png
    ltSpaCh.png
    606.7 KB · Views: 490
  • 4tMedJa.png
    4tMedJa.png
    611 KB · Views: 515
new here so if i'm posting in the wrong forum please let me know where i should go

trying to put together a trailing VWAP script that aggregates data from the past 2 trading days, 3-days, 4-days, week, or month that doesnt reset each week or month. Basically an anchored VWAP script that you dont have to manually update the anchor date each day.

I'm currently using the Anchored VWAP script from tosindicators.com and update the dates every day
input anchorDate = 20210311;

def postAnchorDate = if GetYYYYMMDD() >= anchorDate then 1 else 0;

plot anchoredVWAP = TotalSum(if postAnchorDate then ((high+low+close)/3)*(volume) else 0)/TotalSum(if postAnchorDate then volume else 0);

I tried to change input from a date to a length and redefine the anchordate as the current date minus the length but the script ends up aggregating the data from the entire chart. Additionally, even if the calculation did work as expected, there would be an arithmetic error due to the two day weekend and invalid dates when day = 00
input length = 2;

def anchorDate = GetYYYYMMDD() - length;


def postAnchorDate = if GetYYYYMMDD() >= anchorDate then 1 else 0;

plot anchoredVWAP = TotalSum(if postAnchorDate then ((high+low+close)/3)*(volume) else 0)/TotalSum(if postAnchorDate then volume else 0);

my problem with adding two_days, three_days and four_days aggregation periods to the default TOS VWAP script is that the multi-day VWAPs still reset on monday (so VWAPs on Mondays don't aggregate data from the previous Friday/Thursday/Wednesday) and the four_days aggregation doesnt plot to expectation. Hiding the plot older than the latest aggregation period would be a bonus but i'm unsure how to incoporate the boolean value into the default script.
input numDevDn = -2.0;
input numDevUp = 2.0;
input timeFrame = {default DAY, TWO_DAYS, THREE_DAYS, FOUR_DAYS, WEEK, MONTH};

def cap = getAggregationPeriod();
def errorInAggregation =
timeFrame == timeFrame.DAY and cap >= AggregationPeriod.TWO_DAYS or
timeFrame == timeFrame.TWO_DAYS and cap >= AggregationPeriod.THREE_DAYS or
timeFrame == timeFrame.THREE_DAYS and cap >= AggregationPeriod.FOUR_DAYS or
timeFrame == timeFrame.FOUR_DAYS and cap >=
AggregationPeriod.WEEK or
timeFrame == timeFrame.WEEK and cap >= AggregationPeriod.MONTH;
assert(!errorInAggregation, "timeFrame should be not less than current chart aggregation period");

def yyyyMmDd = getYyyyMmDd();
def periodIndx;
switch (timeFrame) {
case DAY:
periodIndx = yyyyMmDd;
case TWO_DAYS:
periodIndx = Floor((daysFromDate(first(yyyyMmDd)) + getDayOfWeek(first(yyyyMmDd))) / 2);
case THREE_DAYS:
periodIndx = Floor((daysFromDate(first(yyyyMmDd)) + getDayOfWeek(first(yyyyMmDd))) / 3);
case FOUR_DAYS:
periodIndx = Floor((daysFromDate(first(yyyyMmDd)) + getDayOfWeek(first(yyyyMmDd))) / 4);

case WEEK:
periodIndx = Floor((daysFromDate(first(yyyyMmDd)) + getDayOfWeek(first(yyyyMmDd))) / 7);
case MONTH:
periodIndx = roundDown(yyyyMmDd / 100, 0);
}
def isPeriodRolled = compoundValue(1, periodIndx != periodIndx[1], yes);

def volumeSum;
def volumeVwapSum;
def volumeVwap2Sum;

if (isPeriodRolled) {
volumeSum = volume;
volumeVwapSum = volume * vwap;
volumeVwap2Sum = volume * Sqr(vwap);
} else {
volumeSum = compoundValue(1, volumeSum[1] + volume, volume);
volumeVwapSum = compoundValue(1, volumeVwapSum[1] + volume * vwap, volume * vwap);
volumeVwap2Sum = compoundValue(1, volumeVwap2Sum[1] + volume * Sqr(vwap), volume * Sqr(vwap));
}
def price = volumeVwapSum / volumeSum;
def deviation = Sqrt(Max(volumeVwap2Sum / volumeSum - Sqr(price), 0));

plot VWAP = price;
plot UpperBand = price + numDevUp * deviation;
plot LowerBand = price + numDevDn * deviation;

VWAP.setDefaultColor(getColor(0));
UpperBand.setDefaultColor(getColor(2));
LowerBand.setDefaultColor(getColor(4));

i dont understand/recognize how TOS calculates the VWAP so, with my limited understanding and based on the guess that the "isperiodrolled" line resets the aggregation period, my latest attempt to combine the scripts is
input timeFrame = {default DAY, TWO_DAYS, THREE_DAYS, FOUR_DAYS, WEEK, MONTH};

def cap = getAggregationPeriod();
def errorInAggregation =
timeFrame == timeFrame.DAY and cap >= AggregationPeriod.TWO_DAYS or
timeFrame == timeFrame.TWO_DAYS and cap >= AggregationPeriod.THREE_DAYS or
timeFrame == timeFrame.THREE_DAYS and cap >= AggregationPeriod.FOUR_DAYS or
timeFrame == timeFrame.FOUR_DAYS and cap >= AggregationPeriod.WEEK or
timeFrame == timeFrame.WEEK and cap >= AggregationPeriod.MONTH;
assert(!errorInAggregation, "timeFrame should be not less than current chart aggregation period");

def yyyyMmDd = getYyyyMmDd();
def periodIndx;
switch (timeFrame) {
case DAY:
periodIndx = yyyyMmDd;
case TWO_DAYS:
periodIndx = Floor((daysFromDate(first(yyyyMmDd)) + getDayOfWeek(first(yyyyMmDd))) / 2);
case THREE_DAYS:
periodIndx = Floor((daysFromDate(first(yyyyMmDd)) + getDayOfWeek(first(yyyyMmDd))) / 3);
case FOUR_DAYS:
periodIndx = Floor((daysFromDate(first(yyyyMmDd)) + getDayOfWeek(first(yyyyMmDd))) / 4);
case WEEK:
periodIndx = Floor((daysFromDate(first(yyyyMmDd)) + getDayOfWeek(first(yyyyMmDd))) / 7);
case MONTH:
periodIndx = roundDown(yyyyMmDd / 100, 0);
}

def postAnchorDate = if GetYYYYMMDD() >= periodIndx then 1 else 0;

plot anchoredVWAP = TotalSum(if postAnchorDate then ((high+low+close)/3)*(volume) else 0)/TotalSum(if postAnchorDate then volume else 0);
but i'm sure i'm doing something horribly wrong since it just aggregates data from the entire chart. Any help would be appreciated

Thanks in advance
 
new here so if i'm posting in the wrong forum please let me know where i should go

trying to put together a trailing VWAP script that aggregates data from the past 2 trading days, 3-days, 4-days, week, or month that doesnt reset each week or month. Basically an anchored VWAP script that you dont have to manually update the anchor date each day.

I'm currently using the Anchored VWAP script from tosindicators.com and update the dates every day


I tried to change input from a date to a length and redefine the anchordate as the current date minus the length but the script ends up aggregating the data from the entire chart. Additionally, even if the calculation did work as expected, there would be an arithmetic error due to the two day weekend and invalid dates when day = 00


my problem with adding two_days, three_days and four_days aggregation periods to the default TOS VWAP script is that the multi-day VWAPs still reset on monday (so VWAPs on Mondays don't aggregate data from the previous Friday/Thursday/Wednesday) and the four_days aggregation doesnt plot to expectation. Hiding the plot older than the latest aggregation period would be a bonus but i'm unsure how to incoporate the boolean value into the default script.


i dont understand/recognize how TOS calculates the VWAP so, with my limited understanding and based on the guess that the "isperiodrolled" line resets the aggregation period, my latest attempt to combine the scripts is

but i'm sure i'm doing something horribly wrong since it just aggregates data from the entire chart. Any help would be appreciated

Thanks in advance
i figured out how to make my original request work on a weekly chart by using countTradingDays but i'm not sure if there's a way to get the number of trading days of the last candle on the chart to make the script below work on multiple timeframes

input length = 0;

def AnchorDate = if (CountTradingDays(First(GetYYYYMMDD()), GetYYYYMMDD()) + length) > 5 then 1 else 0;

plot trailingVWAP = TotalSum(if anchorDate then ((high+low+close)/3)*(volume) else 0)/TotalSum(if anchorDate then volume else 0);
 
i figured out how to make my original request work on a weekly chart by using countTradingDays but i'm not sure if there's a way to get the number of trading days of the last candle on the chart to make the script below work on multiple timeframes

See if this helps. Each day's bars are denoted the same value starting with 0. So if you wanted the VWAP to be anchored for the last 5 days, you would input length = 5 and use thisday < length as the constraint for daily and less than daily timeframe charts.
Code:
input length = 5;
def ymd      = GetYYYYMMDD();
def dayCount = CompoundValue(1, if !IsNaN(close) and ymd != ymd[1] then dayCount[1] + 1 else dayCount[1], 0);
def thisDay  = (HighestAll(dayCount) - dayCount);

plot trailingVWAP = TotalSum(if thisDay < length then ((high + low + close) / 3) * (volume) else 0) / TotalSum(if thisDay < length then volume else 0);
Thanks! this worked perfectly. I had to add + 1 to the length so lagging period was defined properly. If anyone else is interested the script is below where input = 0 will show the current day's VWAP

edit: actually just realizing this doesnt exclude weekends so the aggregation periods still get a little wonky. still learning thinkscript but this is still really helpful and i think i can still get this to work (attached photo of SPY Monday with VWAP with current day aggregate and current day + yesterday (but ideally should be Friday thru Monday)
 
Last edited:
@thinky Most likely because these indicators require more than just a single day of data.
Hey Ben! I am curious if it would be possible to change the inputs to selecting the period (day, week, month), and pivot high or pivot low for that period to anchor the vwap to that pivot? Thought it might be a little easier to set the indicator that way. Really great work!
 

Similar threads

Not the exact question you're looking for?

Start a new thread and receive assistance from our community.

87k+ Posts
321 Online
Create Post

Similar threads

Similar threads

The Market Trading Game Changer

Join 2,500+ subscribers inside the useThinkScript VIP Membership Club
  • Exclusive indicators
  • Proven strategies & setups
  • Private Discord community
  • ‘Buy The Dip’ signal alerts
  • Exclusive members-only content
  • Add-ons and resources
  • 1 full year of unlimited support

Frequently Asked Questions

What is useThinkScript?

useThinkScript is the #1 community of stock market investors using indicators and other tools to power their trading strategies. Traders of all skill levels use our forums to learn about scripting and indicators, help each other, and discover new ways to gain an edge in the markets.

How do I get started?

We get it. Our forum can be intimidating, if not overwhelming. With thousands of topics, tens of thousands of posts, our community has created an incredibly deep knowledge base for stock traders. No one can ever exhaust every resource provided on our site.

If you are new, or just looking for guidance, here are some helpful links to get you started.

What are the benefits of VIP Membership?
VIP members get exclusive access to these proven and tested premium indicators: Buy the Dip, Advanced Market Moves 2.0, Take Profit, and Volatility Trading Range. In addition, VIP members get access to over 50 VIP-only custom indicators, add-ons, and strategies, private VIP-only forums, private Discord channel to discuss trades and strategies in real-time, customer support, trade alerts, and much more. Learn all about VIP membership here.
How can I access the premium indicators?
To access the premium indicators, which are plug and play ready, sign up for VIP membership here.
Back
Top