MindPortal
New member
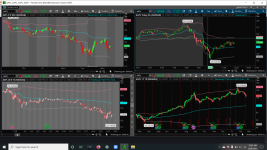
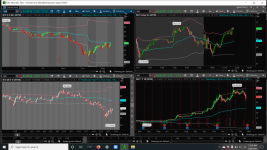
Quartly Interval for VWAP- Help PLEASE!! I have this I found online, Can't wrap my head around adding a quarterly timeframe
Code:
input timeFrame = {default Day, Week, Month, Year, Minute, Hour, Chart, "Opt Exp", Bar};
input BandType = {default Standard, "1/4 Day Range", "3x Avg Bar Range", ThinkScripter, None};
input ShowCloud = yes;
input HideSdLines = no;

def cap = GetAggregationPeriod();
def errorInAggregation =
    timeFrame == timeFrame.Day and cap >= AggregationPeriod.WEEK or
    timeFrame == timeFrame.Week and cap >= AggregationPeriod.MONTH;
Assert(!errorInAggregation, "timeFrame should be not less than current chart aggregation period");

def yyyyMmDd = GetYYYYMMDD();
def seconds = SecondsFromTime(0);
def month = GetYear() * 12 + GetMonth();
def year = GetYear();
def day_number = DaysFromDate(First(yyyyMmDd)) + GetDayOfWeek(First(yyyyMmDd));
def dom = GetDayOfMonth(yyyyMmDd);
def dow = GetDayOfWeek(yyyyMmDd - dom + 1);
def expthismonth = (if dow > 5 then 27 else 20) - dow;
def exp_opt = month + (dom > expthismonth);
def periodIndx;

switch (timeFrame) {
case Chart:
    periodIndx = 0;

case Minute:
    periodIndx = Floor(seconds / 60 + day_number * 24 * 60);

case Hour:
    periodIndx = Floor(seconds / 3600 + day_number * 24);

case Day:
    periodIndx = CountTradingDays(Min(First(yyyyMmDd), yyyyMmDd), yyyyMmDd) - 1;

case Week:
    periodIndx = Floor(day_number / 7);

case Month:
    periodIndx = Floor(month - First(month));

case Year:
    periodIndx = Floor(year - First(year));

case "Opt Exp":
    periodIndx = exp_opt - First(exp_opt);

case Bar:
    periodIndx = BarNumber() - 1;
}
def isPeriodRolled = CompoundValue(1, periodIndx != periodIndx[1], yes);

def volumeSum;
def volumeVwapSum;
def volumeVwap2Sum;

if (isPeriodRolled) {
    volumeSum = volume;
    volumeVwapSum = volume * vwap;
    volumeVwap2Sum = volume * Sqr(vwap);
} else {
    volumeSum = compoundValue(1, volumeSum[1] + volume, volume);
    volumeVwapSum = compoundValue(1, volumeVwapSum[1] + volume * vwap, volume * vwap);
    volumeVwap2Sum = compoundValue(1, volumeVwap2Sum[1] + volume * Sqr(vwap), volume * Sqr(vwap));
}
def price = volumeVwapSum / volumeSum;

def deviation;
switch (BandType) {

case Standard:
    deviation = Sqrt(Max(volumeVwap2Sum / volumeSum - Sqr(price), 0));

case "1/4 Day Range":
    deviation = Sqrt(AbsValue(high(Period = timeFrame) - low(Period = timeFrame)) * .25);

case "3x Avg Bar Range":
    deviation = Sqrt(Average(TrueRange(high,  close,  low),  20) * 3);

case ThinkScripter:
    deviation = Sqrt(TotalSum(Sqr(((open + high + low + close) / 4) - price) * volume) / TotalSum(volume));

case None:
    deviation = Double.NaN;
}

plot VWAP = price;
VWAP.SetDefaultColor(CreateColor(40, 40, 40));

VWAP.SetStyle(Curve.SHORT_DASH);
VWAP.SetLineWeight(2);

# TS_CHART_VWAP_SD_BANDS
# [URL]http://www.thinkscripter.com[/URL]
# [EMAIL][email protected][/EMAIL]
# Last Update 03 APR 2010

input VWAPStdev1 = 0.5;
input VWAPStdev2 = 1.0;
input VWAPStdev3 = 1.5;
input VWAPStDev4 = 2.0;

plot r1 = VWAP + VWAPStdev1 * deviation;
plot s1 = VWAP - VWAPStdev1 * deviation;
plot r2 = VWAP + VWAPStdev2 * deviation;
plot s2 = VWAP - VWAPStdev2 * deviation;
plot r3 = VWAP + VWAPStdev3 * deviation;
plot s3 = VWAP - VWAPStdev3 * deviation;
plot r4 = VWAP + VWAPStdev4 * deviation;
plot s4 = VWAP - VWAPStdev4 * deviation;

DefineGlobalColor("sDev1", (CreateColor(70, 70, 70)));
DefineGlobalColor("sDev2", (CreateColor(128, 128, 128)));
DefineGlobalColor("sDev3", (CreateColor(100, 100, 100)));
DefineGlobalColor("sDev4", (CreateColor(100, 100, 100)));


r1.SetDefaultColor(GlobalColor("sDev1"));
s1.SetDefaultColor(GlobalColor("sDev1"));
r2.SetDefaultColor(GlobalColor("sDev2"));
s2.SetDefaultColor(GlobalColor("sDev2"));
r3.SetDefaultColor(GlobalColor("sDev2"));
s3.SetDefaultColor(GlobalColor("sDev2"));
r4.SetDefaultColor(Color.DOWNTICK);
s4.SetDefaultColor(Color.UPTICK);


r1.SetStyle(Curve.SHORT_DASH);
r2.SetStyle(Curve.SHORT_DASH);
r3.SetStyle(Curve.SHORT_DASH);
r4.SetStyle(Curve.SHORT_DASH);
s1.SetStyle(Curve.SHORT_DASH);
s2.SetStyle(Curve.SHORT_DASH);
s3.SetStyle(Curve.SHORT_DASH);
s4.SetStyle(Curve.SHORT_DASH);


VWAP.HideBubble();
r1.HideBubble();
r2.HideBubble();
r3.HideBubble();
r4.HideBubble();
s1.HideBubble();
s2.HideBubble();
s3.HideBubble();
s4.HideBubble();

r1.SetHiding(HideSdLines);
r2.SetHiding(HideSdLines);
r3.SetHiding(HideSdLines);
r4.SetHiding(HideSdLines);
s1.SetHiding(HideSdLines);
s2.SetHiding(HideSdLines);
s3.SetHiding(HideSdLines);
s4.SetHiding(HideSdLines);


#AddCloud(VWAP, r1, GlobalColor("sDev3"), GlobalColor("sDev3"));
#AddCloud(VWAP, s1, GlobalColor("sDev3"), GlobalColor("sDev3"));
AddCloud(VWAP, r2, GlobalColor("sDev1"), GlobalColor("sDev1"));
AddCloud(VWAP, s2, GlobalColor("sDev1"), GlobalColor("sDev1"));