allnetbrett
New member
I have been enjoying the AVWAP tool based on longer time frames. I have found AVWAP being a great reference point when using the Covid Crash as the anchor. Many equities hit the Covid Lows AVWAP late 2022/early 2023 and bounced during this big rally.
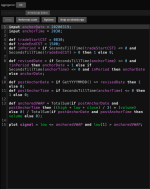
However, I have been getting stuck on the coding for a scan.
Can some create a Scan for when Price crosses this AVWAP indicator (above or below) ?
Here is the tos link. https://tos.mx/3GZM8D9
Thank you in advance
However, I have been getting stuck on the coding for a scan.
Can some create a Scan for when Price crosses this AVWAP indicator (above or below) ?
Here is the tos link. https://tos.mx/3GZM8D9
Thank you in advance
Ruby:
input anchorDate = 20200319;
input anchorTime = 2030;

def tradeStartCST = 0830;
def tradeEndCST = 1500;
def inPeriod = if SecondsTillTime(tradeStartCST) <= 0 and SecondsTillTime(tradeEndCST) > 0 then 1 else 0;

def revisedDate = if SecondsTillTime(anchorTime)<=0 and !inPeriod then anchorDate+1 else if SecondsTillTime(anchorTime)<=0 and inPeriod then anchorDate else anchorDate;

def postAnchorDate = if GetYYYYMMDD() >= revisedDate then 1 else 0;
def postAnchorTime = if SecondsTillTime(anchorTime) <= 0 then 1 else 0;

plot anchoredVWAP = TotalSum(if postAnchorDate and postAnchorTime then ((high+low+close)/3)*(volume) else 0)/TotalSum(if postAnchorDate and postAnchorTime then volume else 0);

anchoredVWAP.setStyle(Curve.Firm);
anchoredVWAP.SetLineWeight(3);
anchoredVWAP.SetDefaultColor(Color.Cyan);

anchoredVWAP.setDefaultColor(getColor(0));
anchoredVWAP.AssignValueColor(if close>=VWAP then Color.Green else Color.Red);

#AddChartBubble(yes,close, revisedDate, color.yellow);
Last edited by a moderator:

