
RmS59
Member
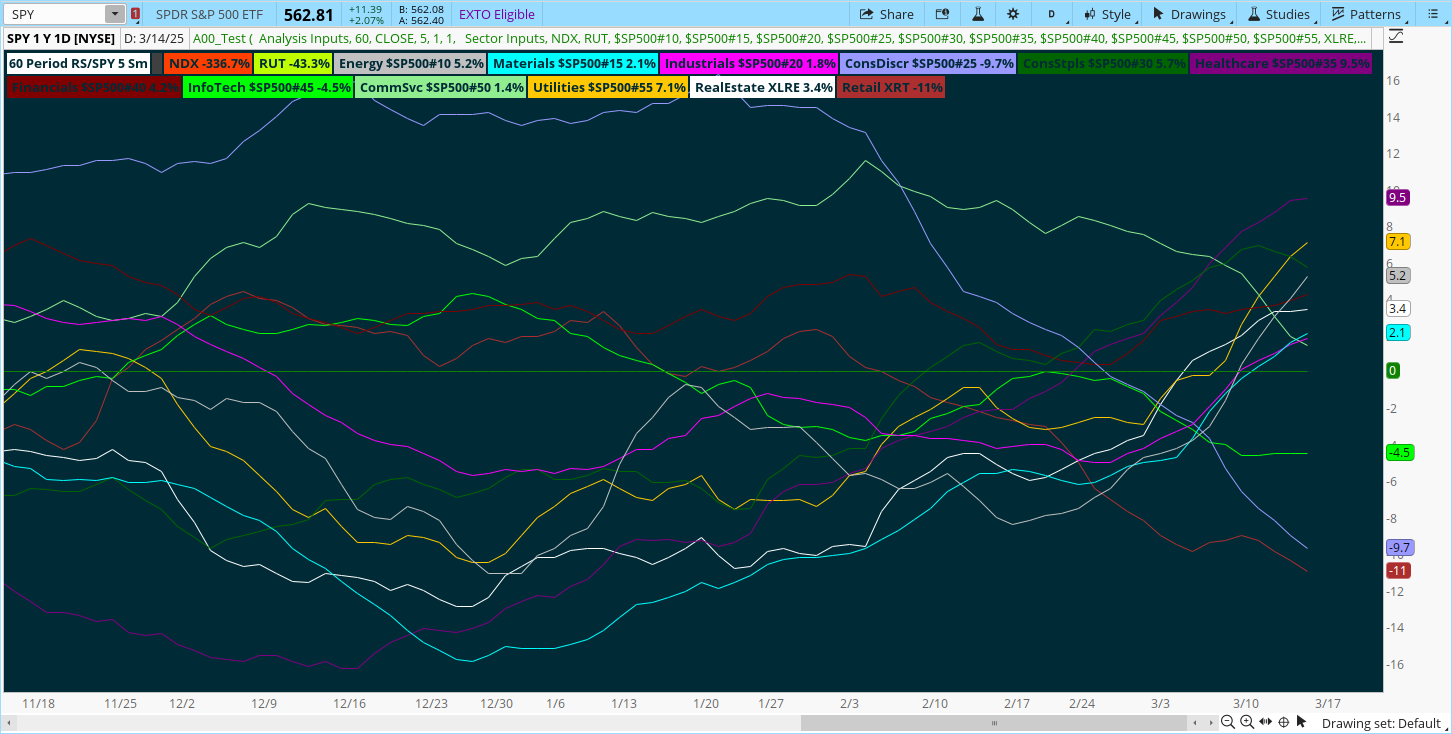
Here is a Sector Analysis Study that I created a few years ago and like. It ranks the sectors vs SP500 (or other). Also see the second version below.
I developed the Relative Performance study first. The Relative Strength compares the sector performance vs the SPX. This also gives you a good idea of performance, but be wary when the SPX is down. A sector's performance may be better than the SPX, but still not be positive.
So, I look at the Relative Strength first to see how the sectors compare to SPX, then check the RoC to see if change is actually positive.
Since I mostly trade daily charts, I look at these indicators on a daily chart looking back 13 periods. When I trade weekly charts, I look at the same indicators on a weekly chart.
This study shows sector Rate of Change performance over time. It allows best performing sectors to be easily identified.
I developed the Relative Performance study first. The Relative Strength compares the sector performance vs the SPX. This also gives you a good idea of performance, but be wary when the SPX is down. A sector's performance may be better than the SPX, but still not be positive.
So, I look at the Relative Strength first to see how the sectors compare to SPX, then check the RoC to see if change is actually positive.
Since I mostly trade daily charts, I look at these indicators on a daily chart looking back 13 periods. When I trade weekly charts, I look at the same indicators on a weekly chart.
Code:
# SectorRelativePerformance
################
# Displays relative performance over defined period
# Intended for Sector Analysis
# Created 7/15/18 RmS59

declare lower;

input n1 = "  Analysis Inputs";
input Period = 60;
input price = FundamentalType.CLOSE;
input smoothPeriod = 5;
input DisplayLabel = 1;
input DisplayAltIndex = 1;

input n2 = "  Sector Inputs";
#input Base = "SPX";
input AltIndex1 = "NDX";
input AltIndex2 = "RUT";

input Energy = {default "$SP500#10","XLE"};
input Materials = {default "$SP500#15", "XLB"};
input Industrials = {default "$SP500#20", "XLI"};
input ConsDiscr = {default "$SP500#25", "XLY"};
input ConsStpls = {default "$SP500#30", "XLP"};
input Healthcare = {default "$SP500#35", "XLV"};
input Financials = {default "$SP500#40", "XLF"};
input InfoTech = {default "$SP500#45", "XLK"};
input Telecom = {default "$SP500#50", "IYZ", "XLC"};
input Utilities = {default "$SP500#55", "XLU"};
input RealEstate = "XLRE";
input Retail = "XRT";

# For Reference, the S&P500 Sectors are as follows:
# Energy = "$SP500#10";
# Materials = "$SP500#15";
# Industrials = "$SP500#20";
# ConsDiscr = "$SP500#25";
# ConsStpls = "$SP500#30";
# Healthcare = "$SP500#35";
# Financials = "$SP500#40";
# InfoTech = "$SP500#45"
# Telecom = "$SP500#50";
# Utilities = "$SP500#55";


def priceBase = Fundamental(price);
#def priceBase = Fundamental(price, Base);
def priceAltIndex1 = Fundamental(price, AltIndex1);
def priceAltIndex2 = Fundamental(price, AltIndex2);

def priceEnergy = Fundamental(price, Energy);
def priceMaterials = Fundamental(price, Materials);
def priceIndustrials = Fundamental(price, Industrials);
def priceConsDiscr = Fundamental(price, ConsDiscr);
def priceConsStpls = Fundamental(price, ConsStpls);
def priceHealthcare = Fundamental(price, Healthcare);
def priceFinancials = Fundamental(price, Financials);
def priceInfoTech = Fundamental(price, InfoTech);
def priceTelecom = Fundamental(price, Telecom);
def priceUtilities = Fundamental(price, Utilities);
def priceRealEstate = Fundamental(price, RealEstate);
def priceRetail = Fundamental(price, Retail);

def changeBase = (priceBase - priceBase[Period]) / priceBase[Period];
def changeAltIndex1 = (priceAltIndex1 - priceAltIndex1[Period]) / priceBase[Period];
def changeAltIndex2 = (priceAltIndex2 - priceAltIndex2[Period]) / priceBase[Period];

def changeEnergy = (priceEnergy - priceEnergy[Period]) / priceEnergy[Period];
def changeMaterials = (priceMaterials - priceMaterials[Period]) / priceMaterials[Period];
def changeIndustrials = (priceIndustrials - priceIndustrials[Period]) / priceIndustrials[Period];
def changeConsDiscr = (priceConsDiscr - priceConsDiscr[Period]) / priceConsDiscr[Period];
def changeConsStpls = (priceConsStpls - priceConsStpls[Period]) / priceConsStpls[Period];
def changeHealthcare = (priceHealthcare - priceHealthcare[Period]) / priceHealthcare[Period];
def changeFinancials = (priceFinancials - priceFinancials[Period]) / priceFinancials[Period];
def changeInfoTech = (priceInfoTech - priceInfoTech[Period]) / priceInfoTech[Period];
def changeTelecom = (priceTelecom - priceTelecom[Period]) / priceTelecom[Period];
def changeUtilities = (priceUtilities - priceUtilities[Period]) / priceUtilities[Period];
def changeRealEstate = (priceRealEstate - priceRealEstate[Period]) / priceRealEstate[Period];
def changeRetail = (priceRetail - priceRetail[Period]) / priceRetail[Period];

plot BasePerf = if priceBase == 0 then Double.NaN else round(movAvgExponential(changeBase - changeBase,2),smoothPeriod);
plot AltIndex1Perf = if priceAltIndex1== 0 then Double.NaN else round(100*(changeAltIndex1 - changeBase),1);
plot AltIndex2Perf = if priceAltIndex2== 0 then Double.NaN else round(100*(changeAltIndex2 - changeBase),1);

plot EnergyPerf = if priceEnergy == 0 then Double.NaN else round(expAverage(100*(changeEnergy - changeBase),smoothPeriod),1);
plot MaterialsPerf = if priceMaterials == 0 then Double.NaN else round(expAverage(100*(changeMaterials - changeBase),smoothPeriod),1);
plot IndustrialsPerf = if priceIndustrials== 0 then Double.NaN else round(expAverage(100*(changeIndustrials - changeBase),smoothPeriod),1);
plot ConsDiscrPerf = if priceConsDiscr== 0 then Double.NaN else round(expAverage(100*(changeConsDiscr - changeBase),smoothPeriod) ,1);
plot ConsStplsPerf = if priceConsStpls== 0 then Double.NaN else round(expAverage(100*(changeConsStpls - changeBase),smoothPeriod),1);
plot HealthcarePerf = if priceHealthcare== 0 then Double.NaN else round(expAverage(100*(changeHealthcare - changeBase),smoothPeriod),1);
plot FinancialsPerf = if priceFinancials== 0 then Double.NaN else round(expAverage(100*(changeFinancials - changeBase),smoothPeriod),1);
plot InfoTechPerf = if priceInfoTech== 0 then Double.NaN else round(expAverage(100*(changeInfoTech - changeBase),smoothPeriod),1);
plot TelecomPerf = if priceTelecom== 0 then Double.NaN else round(expAverage(100*(changeTelecom - changeBase),smoothPeriod),1);
plot UtilitiesPerf = if priceUtilities== 0 then Double.NaN else round(expAverage(100*(changeUtilities - changeBase),smoothPeriod),1);
plot RealEstatePerf = if priceRealEstate== 0 then Double.NaN else round(expAverage(100*(changeRealEstate - changeBase),smoothPeriod),1);
plot RetailPerf = if priceRetail== 0 then Double.NaN else round(expAverage(100*(changeRetail - changeBase),smoothPeriod),1);

plot Zero = if !IsNaN(close) then 0 else Double.NaN;

AltIndex1Perf.SetDefaultColor(Color.LIGHT_RED);
AltIndex2Perf.SetDefaultColor(Color.LIME);

EnergyPerf.SetDefaultColor(Color.LIGHT_GRAY);
MaterialsPerf.SetDefaultColor(Color.CYAN);
IndustrialsPerf.SetDefaultColor(Color.MAGENTA);
ConsDiscrPerf.SetDefaultColor(Color.VIOLET);
ConsStplsPerf.SetDefaultColor(Color.DARK_GREEN);
HealthcarePerf.SetDefaultColor(Color.PLUM);
FinancialsPerf.SetDefaultColor(Color.DARK_RED);
InfoTechPerf.SetDefaultColor(Color.GREEN);
TelecomPerf.SetDefaultColor(Color.LIGHT_GREEN);
UtilitiesPerf.SetDefaultColor(Color.ORANGE);
RealEstatePerf.SetDefaultColor(Color.White);

AddLabel(DisplayLabel, period +" Period RS/"+ GetUnderlyingSymbol() + " " + smoothPeriod + " Sm",  Color.WHITE);
AddLabel(DisplayLabel, "  ",Color.DARK_GRAY);
AddLabel(DisplayLabel && DisplayAltIndex, " "+ AltIndex1 + " " + AltIndex1Perf + "%",AltIndex1Perf.TakeValueColor());
AddLabel(DisplayLabel && DisplayAltIndex, " "+ AltIndex2 + " " + AltIndex2Perf + "%",AltIndex2Perf.TakeValueColor());

AddLabel(DisplayLabel, " Energy "+ Energy + " " + EnergyPerf + "%",EnergyPerf.TakeValueColor());
AddLabel(DisplayLabel, " Materials "+ Materials + " " + MaterialsPerf + "%",MaterialsPerf.TakeValueColor());
AddLabel(DisplayLabel, " Industrials "+ Industrials + " " + IndustrialsPerf + "%",IndustrialsPerf.TakeValueColor());
AddLabel(DisplayLabel, " ConsDiscr "+ ConsDiscr + " " + ConsDiscrPerf + "%",ConsDiscrPerf.TakeValueColor());
AddLabel(DisplayLabel, " ConsStpls "+ ConsStpls + " " + ConsStplsPerf + "%",ConsStplsPerf.TakeValueColor());
AddLabel(DisplayLabel, " Healthcare "+ Healthcare + " " + HealthcarePerf + "%",HealthcarePerf.TakeValueColor());
AddLabel(DisplayLabel, " Financials "+ Financials + " " + FinancialsPerf + "%",FinancialsPerf.TakeValueColor());
AddLabel(DisplayLabel, " InfoTech "+ InfoTech + " " + InfoTechPerf + "%",InfoTechPerf.TakeValueColor());
AddLabel(DisplayLabel, " CommSvc "+ Telecom + " " + TelecomPerf + "%",TelecomPerf.TakeValueColor());
AddLabel(DisplayLabel, " Utilities "+ Utilities + " " + UtilitiesPerf + "%",UtilitiesPerf.TakeValueColor());
AddLabel(DisplayLabel, " RealEstate "+ RealEstate + " " + RealEstatePerf + "%",RealEstatePerf.TakeValueColor());
AddLabel(DisplayLabel, " Retail "+ Retail + " " + RetailPerf + "%",RetailPerf.TakeValueColor());
#### End
This study shows sector Rate of Change performance over time. It allows best performing sectors to be easily identified.
Code:
Sector_ROC
############

# Sector_ROC
# Displays rate of changeAltIndex1 (%) over defined period
# Intended for Sector Analysis
# Created 9/10/18 RmS59

declare lower;

input n1 = "  Analysis Inputs";
input lookback = 13;
input smoothingPeriod = 19;
input DisplayLabel = 1;
input DisplayIndexes = 1;
input price = FundamentalType.CLOSE;


input n2 = "  Sector Inputs";
input SandP = {default "SPY","SPX"};
input Nasdaq = {default "QQQ","COMP"};
input Russell = {default "IWM","RUT"};

input Energy = {default "XLE","$SP500#10"};
input Materials = {default "XLB", "$SP500#15" };
input Industrials = {default "XLI", "$SP500#20"};
input ConsDiscr = {default "XLY","$SP500#25"};
input ConsStpls = {default "XLP","$SP500#30"};
input Healthcare = {default "XLV","$SP500#35"};
input Financials = {default "XLF","$SP500#40"};
input InfoTech = {default "XLK","$SP500#45"};
input Telecom = {default "IYZ","XLC","$SP500#50"};
input Utilities = {default "XLU","$SP500#55"};
input RealEstate = "XLRE";


def priceSandP = Fundamental(price,SandP);
def priceNasdaq = Fundamental(price, Nasdaq);
def priceRussell = Fundamental(price, Russell);

def priceEnergy = Fundamental(price, Energy);
def priceMaterials = Fundamental(price, Materials);
def priceIndustrials = Fundamental(price, Industrials);
def priceConsDiscr = Fundamental(price, ConsDiscr);
def priceConsStpls = Fundamental(price, ConsStpls);
def priceHealthcare = Fundamental(price, Healthcare);
def priceFinancials = Fundamental(price, Financials);
def priceInfoTech = Fundamental(price, InfoTech);
def priceTelecom = Fundamental(price, Telecom);
def priceUtilities = Fundamental(price, Utilities);
def priceRealEstate = Fundamental(price, RealEstate);


def SandPROC1 = round(expAverage(100*((priceSandP - priceSandP[lookback])/priceSandP[lookback]),smoothingPeriod),1) ;
def NasdaqROC1 = round(expAverage(100*((priceNasdaq - priceNasdaq[lookback])/priceNasdaq[lookback]),smoothingPeriod),1);
def RussellROC1 = round(expAverage(100*((priceRussell - priceRussell[lookback])/priceRussell[lookback]),smoothingPeriod),1) ;

plot SandPROC = if DisplayIndexes then SandPROC1 else Double.NaN;;
plot NasdaqROC = if DisplayIndexes then NasdaqROC1 else Double.NaN;
plot RussellROC = if DisplayIndexes then RussellROC1 else Double.NaN;


plot EnergyROC = round(expAverage(100*((priceEnergy - priceEnergy[lookback])/priceEnergy[lookback]),smoothingPeriod),1);;
plot MaterialsROC = round(expAverage(100*((priceMaterials - priceMaterials[lookback])/priceMaterials[lookback]),smoothingPeriod),1);;
plot IndustrialsROC = round(expAverage(100*((priceIndustrials - priceIndustrials[lookback])/priceIndustrials[lookback]),smoothingPeriod),1);;
plot ConsDiscrROC = round(expAverage(100*((priceConsDiscr - priceConsDiscr[lookback])/priceConsDiscr[lookback]),smoothingPeriod),1);;
plot ConsStplsROC = round(expAverage(100*((priceConsStpls - priceConsStpls[lookback])/priceConsStpls[lookback]),smoothingPeriod),1);;
plot HealthcareROC = round(expAverage(100*((priceHealthcare - priceHealthcare[lookback])/priceHealthcare[lookback]),smoothingPeriod),1);;
plot FinancialsROC = round(expAverage(100*((priceFinancials - priceFinancials[lookback])/priceFinancials[lookback]),smoothingPeriod),1);;
plot InfoTechROC = round(expAverage(100*((priceInfoTech - priceInfoTech[lookback])/priceInfoTech[lookback]),smoothingPeriod),1);;
plot TelecomROC = round(expAverage(100*((priceTelecom - priceTelecom[lookback])/priceTelecom[lookback]),smoothingPeriod),1);;
plot UtilitiesROC = round(expAverage(100*((priceUtilities - priceUtilities[lookback])/priceUtilities[lookback]),smoothingPeriod),1);;
plot RealEstateROC = round(expAverage(100*((priceRealEstate - priceRealEstate[lookback])/priceRealEstate[lookback]),smoothingPeriod),1);;

plot Zero = if !IsNaN(close) then 1 else Double.NaN;
Zero.setDefaultColor(Color.White);
Zero.SetLineWeight(3);

SandPROC.SetDefaultColor(Color.WHITE);
NasdaqROC.SetDefaultColor(Color.LIGHT_RED);
RussellROC.SetDefaultColor(Color.LIME);
SandPROC.SetLineWeight(2);
NasdaqROC.SetLineWeight(2);
RussellROC.SetLineWeight(2);
SandPROC.SetStyle(Curve.SHORT_DASH);
NasdaqROC.SetStyle(Curve.SHORT_DASH);
RussellROC.SetStyle(Curve.SHORT_DASH);

EnergyROC.SetDefaultColor(Color.LIGHT_GRAY);
MaterialsROC.SetDefaultColor(Color.CYAN);
IndustrialsROC.SetDefaultColor(Color.MAGENTA);
ConsDiscrROC.SetDefaultColor(Color.VIOLET);
ConsStplsROC.SetDefaultColor(Color.DARK_GREEN);
HealthcareROC.SetDefaultColor(Color.PLUM);
FinancialsROC.SetDefaultColor(Color.DARK_RED);
InfoTechROC.SetDefaultColor(Color.GREEN);
TelecomROC.SetDefaultColor(Color.LIGHT_GREEN);
UtilitiesROC.SetDefaultColor(Color.ORANGE);
RealEstateROC.SetDefaultColor(Color.White);

AddLabel(DisplayLabel, lookback +" Period ROC " + smoothingPeriod + " Sm",  Color.WHITE); # Smoothing
AddLabel(DisplayLabel, "  ",Color.DARK_GRAY);

AddLabel(DisplayLabel , " S&P " +  SandPROC1 + "%",SandPROC.TakeValueColor());
AddLabel(DisplayLabel , " Nasdaq " + NasdaqROC1 + "%",NasdaqROC.TakeValueColor());
AddLabel(DisplayLabel , " Russell " + RussellROC1 + "%",RussellROC.TakeValueColor());

AddLabel(DisplayLabel, " Energy "+ Energy + " " + EnergyROC + "%",EnergyROC.TakeValueColor());
AddLabel(DisplayLabel, " Materials "+ Materials + " " + MaterialsROC + "%",MaterialsROC.TakeValueColor());
AddLabel(DisplayLabel, " Industrials "+ Industrials + " " + IndustrialsROC + "%",IndustrialsROC.TakeValueColor());
AddLabel(DisplayLabel, " ConsDiscr "+ ConsDiscr + " " + ConsDiscrROC + "%",ConsDiscrROC.TakeValueColor());
AddLabel(DisplayLabel, " ConsStpls "+ ConsStpls + " " + ConsStplsROC + "%",ConsStplsROC.TakeValueColor());
AddLabel(DisplayLabel, " Healthcare "+ Healthcare + " " + HealthcareROC + "%",HealthcareROC.TakeValueColor());
AddLabel(DisplayLabel, " Financials "+ Financials + " " + FinancialsROC + "%",FinancialsROC.TakeValueColor());
AddLabel(DisplayLabel, " InfoTech "+ InfoTech + " " + InfoTechROC + "%",InfoTechROC.TakeValueColor());
AddLabel(DisplayLabel, " Communications "+ Telecom + " " + TelecomROC + "%",TelecomROC.TakeValueColor());
AddLabel(DisplayLabel, " Utilities "+ Utilities + " " + UtilitiesROC + "%",UtilitiesROC.TakeValueColor());
AddLabel(DisplayLabel, " RealEstate "+ RealEstate + " " + RealEstateROC + "%",RealEstateROC.TakeValueColor());


### END
Last edited by a moderator:
")