
@Antares66 please read post #23 above and take advantage of TDA's many videos on youtube.One question: What does "AD" mean exactly? Advance Decline?
You are using an out of date browser. It may not display this or other websites correctly.
You should upgrade or use an alternative browser.
You should upgrade or use an alternative browser.
Advance/Decline Line Indicator for ThinkorSwim
- Thread starter markos
- Start date
-
- Tags
- market internals
Join useThinkScript to post your question to a community of 21,000+ developers and traders.
TOS AdvanceDecline indicator sets color as follows:
How does the label get assigned a color? I tried changing Color.UPTICK to Color.LIGHT_GREEN but that only affects the AD line, not the label. I'd like to change the label colors from the default RED and GREEN.
Full code of the indicator below:
Code:
AD.DefineColor("Up", Color.UPTICK);
AD.DefineColor("Down", Color.DOWNTICK);
AD.AssignValueColor(if advnDecl > advnDecl[1] then AD.color("Up") else AD.color("Down"));
LevelLine.SetDefaultColor(GetColor(7));

AddLabel(type == type."Advance/Decline Ratio", (if advances > declines then round(advances / declines, 2) else round(-declines / advances, 2)) + ":1 Ratio");
How does the label get assigned a color? I tried changing Color.UPTICK to Color.LIGHT_GREEN but that only affects the AD line, not the label. I'd like to change the label colors from the default RED and GREEN.
Full code of the indicator below:
Code:
#
# TD Ameritrade IP Company, Inc. (c) 2010-2019
#

declare lower;

input type = {default "Advance/Decline Line", "Advance/Decline Line (Breadth)", "Advance/Decline Line (Daily)", "Advance/Decline Ratio", "Advance/Decline Spread (Issues)", "Absolute Breadth Index"};
input exchange = {default NYSE, NASDAQ, AMEX};

def advances;
def declines;
switch (exchange) {
case NYSE:
    advances = close("$ADVN");
    declines = close("$DECN");
case NASDAQ:
    advances = close("$ADVN/Q");
    declines = close("$DECN/Q");
case AMEX:
    advances = close("$ADVA");
    declines = close("$DECA");
}
def advnDecl;
def level;
switch (type){
case "Advance/Decline Line":
    advnDecl = advnDecl[1] + if !IsNaN(advances - declines) then advances - declines else 0;
    level = 0;
case "Advance/Decline Line (Breadth)":
    advnDecl = advances / (advances + declines);
    level = 0.5;
case "Advance/Decline Line (Daily)":
    advnDecl = (advances - declines) / (advances + declines);
    level = 0;
case "Advance/Decline Ratio":
    advnDecl = advances / declines;
    level = 1;
case "Advance/Decline Spread (Issues)":
    advnDecl = advances - declines;
    level = 0;
case "Absolute Breadth Index":
    advnDecl = AbsValue(advances - declines);
    level = 0;
}

plot AD = if !IsNaN(close) then advnDecl else Double.NaN;
plot LevelLine = level;

AD.DefineColor("Up", Color.UPTICK);
AD.DefineColor("Down", Color.DOWNTICK);
AD.AssignValueColor(if advnDecl > advnDecl[1] then AD.color("Up") else AD.color("Down"));
LevelLine.SetDefaultColor(GetColor(7));

AddLabel(type == type."Advance/Decline Ratio", (if advances > declines then round(advances / declines, 2) else round(-declines / advances, 2)) + ":1 Ratio");
Last edited:
@dj45 You'll need to define the choice of colors within your AddLabel statement. Assuming you use your definitions of
First make sure you select the input selector Advance/Decline Ratio as defined in your AddLabel statement.
Then replace your AddLabel statement with the following line.
Since the market is closed now you won't see the labels update so run this during RTH next week
Code:
AD.DefineColor("Up", Color.UPTICK);
AD.DefineColor("Down", Color.DOWNTICK);
First make sure you select the input selector Advance/Decline Ratio as defined in your AddLabel statement.
Then replace your AddLabel statement with the following line.
Since the market is closed now you won't see the labels update so run this during RTH next week
Code:
AddLabel(type == type."Advance/Decline Ratio", (if advances > declines then round(advances / declines, 2) else round(-declines / advances, 2)) + ":1 Ratio", if advances > declines then AD.Color("Up") else AD.Color("Down"));I see, so you can run if statements sequentially. Works great (was able to see the change since I still had TOS open from today's RTH session), thanks.AddLabel(type == type."Advance/Decline Ratio", (if advances > declines then round(advances / declines, 2) else round(-declines / advances, 2)) + ":1 Ratio", if advances > declines then AD.Color("Up") else AD.Color("Down"));
")
@Playstation Gotcha, you are referring to Mobius AD Label study. This study measures $ADSPD which is the S&P 500 Advancing Issues - Declining Issues Difference. Essentially it takes the difference between the S&P 500 advancers and the S&P decliners. From today's session since RTH we have a high reading of 231, low reading of 31, current reading of 132.
Bear in mind that the market oscillates between positive readings and negative readings for the day. All avg does is to take an average of the total accumulated AD for the day divided by the count. If you look within the code, here's the formula that displays Avg. If there is any doubt, always look within the study for clues
Bear in mind that the market oscillates between positive readings and negative readings for the day. All avg does is to take an average of the total accumulated AD for the day divided by the count. If you look within the code, here's the formula that displays Avg. If there is any doubt, always look within the study for clues
Code:
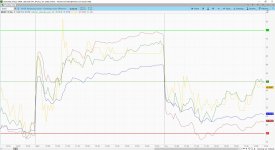
def Avg = Round(sumAD / sumx, 0);Its easy to get advance decline market internals in TOS, however if you want them to be normalized and show on single chart there is some work to be done. This indicator is SNP, Nasdaq, Russel and DJIA percentage normalized (advance decline thrust) . With optional daily start indicator (good for intraday)
Link: https://tos.mx/skf776G

A newer version, Couple of improvements: color changes based on trend and signal line: https://tos.mx/i9WRyEL
Link: https://tos.mx/skf776G
A newer version, Couple of improvements: color changes based on trend and signal line: https://tos.mx/i9WRyEL
Attachments
That https://tos.mx/i9WRyEL is not opening for me Could you help?Its easy to get advance decline market internals in TOS, however if you want them to be normalized and show on single chart there is some work to be done. This indicator is SNP, Nasdaq, Russel and DJIA percentage normalized (advance decline thrust) . With optional daily start indicator (good for intraday)
Link: https://tos.mx/skf776G

A newer version, Couple of improvements: color changes based on trend and signal line: https://tos.mx/i9WRyEL
To Open A Shared Link
- Hover your mouse over the link
- Right-click, chose copy link address
- In TOS, click on gear icon at top of page
- Click on Open Shared Item
- Ctrl-V to paste link address
- Click on Preview
- Name the study, whatever you want
- Click Import
Yes I do all that and get An error occurred while importing sheered itemTo Open A Shared Link
@Zlotko These are the steps I followed and it opened for me. Please post a screenshot of where the process is failing for you.
- Hover your mouse over the link
- Right-click, chose copy link address
- In TOS, click on gear icon at top of page
- Click on Open Shared Item
- Ctrl-V to paste link address
- Click on Preview
- Name the study, whatever you want
- Click Import
@Zlotko For future reference, it is easier to help you troubleshoot errors, if you provide a screenshot showing the issue.
I downloaded the study successfully using the above method which means you either have a corrupted application (fixed by reinstalling TOS) or a user error in following the above directions.
In the short-term, here is the study that you were attempting to download.
Long-term, if you continue to have issues with opening shared links using the above method, you should contact customer support.
HTH
I downloaded the study successfully using the above method which means you either have a corrupted application (fixed by reinstalling TOS) or a user error in following the above directions.
In the short-term, here is the study that you were attempting to download.
Ruby:
declare lower;

input showbreak=yes;
input avglength=3;
def break =  getweek()<>getweek()[1] ;

AddVerticalLine(showbreak and break, "NewWk", Color.GRAY, 1);

DefineGlobalColor("NYSE", Color.GRAY);
DefineGlobalColor("SNP", Color.GREEN);
DefineGlobalColor("SNPDN", Color.Dark_GREEN);
DefineGlobalColor("NQ", CreateColor(102,204,55));
DefineGlobalColor("NQDN", CreateColor(0,0,155));
DefineGlobalColor("DJI", Color.RED);
DefineGlobalColor("DJIDN", Color.Dark_RED);
DefineGlobalColor("RUT", Color.yellow);
DefineGlobalColor("RUTDN", Color.dark_ORANGE);

script ADPct{
input tickup="$ADVSP";
input tickdn="$DECLSP";
input tickunch="$UNCHSP";
def advances=close(tickup);
def declines=close(tickdn);
def total=close(tickup)+ close(tickdn)+close(tickunch);
def calc =
    if isnan(calc[1]) then 0
    else
        if Total<>0 then advances/(total)*100 else 0;
plot ADPct=calc;
};

plot ob=80; ob.setDefaultColor(color.green);ob.setLineWeight(2);
plot os=20; os.setDefaultColor(color.red);os.setLineWeight(2);

plot adSNP=ADpct();
def avgadsnp=average(adsnp,avglength);
adSNP.assignvaluecolor(if adSNP>avgADSNP then GlobalColor("SNP") else GlobalColor("SNPDN"));

plot adDJI=ADpct("$ADVI","$DECLI","$UNCHI");
def avgADDJI=average(adsnp,avglength);
ADDJI.assignvaluecolor(if adDJI>avgADDJI  then GlobalColor("DJI") else GlobalColor("DJIDN"));

plot ADNQ=ADpct("$ADVN/Q","$DECN/Q","$UNCN/Q");
def avgADNQ=average(adNQ,avglength);
ADNQ.assignvaluecolor(if adNQ>avgADNQ then GlobalColor("NQ") else GlobalColor("NQDN"));

plot ADRUT=ADpct("$ADVRL","$DECLRL","$UNCHRL"); adRUT.setdefaultcolor(GlobalColor("RUT"));
def avgADRUT=average(adRUT,avglength);
ADRUT.assignvaluecolor(if adRUT>avgADRUT then GlobalColor("RUT") else GlobalColor("RUTDN"));


plot signal=50;
signal.setlineweight(2);
signal.SetPaintingStrategy(paintingStrategy.LINE_VS_POINTS);
signal.assignValueColor
   (if  adNQ>avgADNQ and  adDJI>avgADDJI and  adSNP>avgADSNP then color.green
    else if adNQ<avgADNQ and  adDJI<avgADDJI and  adSNP<avgADSNP then color.red
   else color.gray);
Long-term, if you continue to have issues with opening shared links using the above method, you should contact customer support.
HTH
Perfect Thank you@Zlotko For future reference, it is easier to help you troubleshoot errors, if you provide a screenshot showing the issue.
I downloaded the study successfully using the above method which means you either have a corrupted application (fixed by reinstalling TOS) or a user error in following the above directions.
In the short-term, here is the study that you were attempting to download.
Ruby:declare lower; input showbreak=yes; input avglength=3; def break = getweek()<>getweek()[1] ; AddVerticalLine(showbreak and break, "NewWk", Color.GRAY, 1); DefineGlobalColor("NYSE", Color.GRAY); DefineGlobalColor("SNP", Color.GREEN); DefineGlobalColor("SNPDN", Color.Dark_GREEN); DefineGlobalColor("NQ", CreateColor(102,204,55)); DefineGlobalColor("NQDN", CreateColor(0,0,155)); DefineGlobalColor("DJI", Color.RED); DefineGlobalColor("DJIDN", Color.Dark_RED); DefineGlobalColor("RUT", Color.yellow); DefineGlobalColor("RUTDN", Color.dark_ORANGE); script ADPct{ input tickup="$ADVSP"; input tickdn="$DECLSP"; input tickunch="$UNCHSP"; def advances=close(tickup); def declines=close(tickdn); def total=close(tickup)+ close(tickdn)+close(tickunch); def calc = if isnan(calc[1]) then 0 else if Total<>0 then advances/(total)*100 else 0; plot ADPct=calc; }; plot ob=80; ob.setDefaultColor(color.green);ob.setLineWeight(2); plot os=20; os.setDefaultColor(color.red);os.setLineWeight(2); plot adSNP=ADpct(); def avgadsnp=average(adsnp,avglength); adSNP.assignvaluecolor(if adSNP>avgADSNP then GlobalColor("SNP") else GlobalColor("SNPDN")); plot adDJI=ADpct("$ADVI","$DECLI","$UNCHI"); def avgADDJI=average(adsnp,avglength); ADDJI.assignvaluecolor(if adDJI>avgADDJI then GlobalColor("DJI") else GlobalColor("DJIDN")); plot ADNQ=ADpct("$ADVN/Q","$DECN/Q","$UNCN/Q"); def avgADNQ=average(adNQ,avglength); ADNQ.assignvaluecolor(if adNQ>avgADNQ then GlobalColor("NQ") else GlobalColor("NQDN")); plot ADRUT=ADpct("$ADVRL","$DECLRL","$UNCHRL"); adRUT.setdefaultcolor(GlobalColor("RUT")); def avgADRUT=average(adRUT,avglength); ADRUT.assignvaluecolor(if adRUT>avgADRUT then GlobalColor("RUT") else GlobalColor("RUTDN")); plot signal=50; signal.setlineweight(2); signal.SetPaintingStrategy(paintingStrategy.LINE_VS_POINTS); signal.assignValueColor (if adNQ>avgADNQ and adDJI>avgADDJI and adSNP>avgADSNP then color.green else if adNQ<avgADNQ and adDJI<avgADDJI and adSNP<avgADSNP then color.red else color.gray);
Long-term, if you continue to have issues with opening shared links using the above method, you should contact customer support.
HTH
For TOS, is there a script to percent of SPX or NDX stocks above/below an moving average such as 5 days or 21 days?
I want to have a script which will plot "percent of SP 500 of stocks" over say 5 day SMA. This script will plot as an Oscillator between near Zero and near 100. For example TOS has a symbol (not script for it) " $SPXA50R " which plots percent of SP 500 stocks above 50 day SMA.
If such a script exists, one can use other indicator scripts to see % of SP 500 stocks meeting script criteria.
Thanks
VKB
Last edited by a moderator:
We cannot "count the number of stocks in NYSE, AMEX, NASDAQ, SPY" because what stock is in what index is not information available in ThinkScript. Therefore, the data needed to calculate percentage of stocks in an index is not available.
Last edited:
PFarrington
New member
10:11 Mobius: AD (Advance/Decline Line) is an Intraday indicator. It's daily closing value isn't of any value since where it closes in relation to the closing price has no correlation.
Code:# # TD Ameritrade IP Company, Inc. (c) 2010-2020 # declare lower; input type = {default "Advance/Decline Line", "Advance/Decline Line (Breadth)", "Advance/Decline Line (Daily)", "Advance/Decline Ratio", "Advance/Decline Spread (Issues)", "Absolute Breadth Index"}; input exchange = {default NYSE, NASDAQ, AMEX}; def advances; def declines; switch (exchange) { case NYSE: advances = close("$ADVN"); declines = close("$DECN"); case NASDAQ: advances = close("$ADVN/Q"); declines = close("$DECN/Q"); case AMEX: advances = close("$ADVA"); declines = close("$DECA"); } def advnDecl; def level; switch (type){ case "Advance/Decline Line": advnDecl = advnDecl[1] + if !IsNaN(advances - declines) then advances - declines else 0; level = 0; case "Advance/Decline Line (Breadth)": advnDecl = advances / (advances + declines); level = 0.5; case "Advance/Decline Line (Daily)": advnDecl = (advances - declines) / (advances + declines); level = 0; case "Advance/Decline Ratio": advnDecl = advances / declines; level = 1; case "Advance/Decline Spread (Issues)": advnDecl = advances - declines; level = 0; case "Absolute Breadth Index": advnDecl = AbsValue(advances - declines); level = 0; } plot AD = if !IsNaN(close) then advnDecl else Double.NaN; plot LevelLine = level; AD.DefineColor("Up", Color.UPTICK); AD.DefineColor("Down", Color.DOWNTICK); AD.AssignValueColor(if advnDecl > advnDecl[1] then AD.color("Up") else AD.color("Down")); LevelLine.SetDefaultColor(GetColor(7)); AddLabel(type == type."Advance/Decline Ratio", (if advances > declines then round(advances / declines, 2) else round(-declines / advances, 2)) + ":1 Ratio");
Plots the Advance Decline Line Scaled to Current Price with a horizontal line at the RTH Open.
Code:# AD Line Scaled and Plotted on Upper Graph # Mobius input sym = "$ADSPD"; #hint sym: Symbol to be scaled to current price chart. def AD = close(symbol = sym); def Min = lowestAll(low); def Max = highestAll(high); def bar = barNumber(); def Today = getDay() == getLastDay(); script ScaleFunction{ input c = 0; input Min = -1; input Max = 1; def hh = HighestAll(c); def ll = LowestAll(c); plot Range = (((Max - Min) * (c - ll)) / (hh - ll)) + Min; } script LinePlot { input LineLimit = 0; input OnExpansion = yes; input data = close; input bar = 0; def ThisBar = HighestAll(bar); def cLine = if bar == ThisBar then data else Double.NaN; def cond1 = CompoundValue(1, if IsNaN(data) then cond1[1] else data, data); plot P = if ThisBar - LineLimit <= bar then HighestAll(cLine) else Double.NaN; } plot ADline = if Today then scaleFunction(c = AD, Min = Min, Max = Max) else double.nan; ADline.SetDefaultColor(Color.gray); def RTH_Bar1 = if SecondsTillTime(0930) == 0 and SecondsFromTime(0930) == 0 then bar else RTH_Bar1[1]; def OpenAD = if bar == RTH_Bar1 then ADline else OpenAD[1]; def ADLimit = if bar != RTH_Bar1 then bar - RTH_Bar1 else if bar == RTH_Bar1 then Double.NaN else ADLimit[1]; plot AD_RTH_open = LinePlot(LineLimit = ADLimit, data = OpenAD, bar = RTH_Bar1); AD_RTH_open.SetDefaultColor(Color.gray); AddLabel(1, "AD = " + AD, if AD > 0 then color.green else color.red); # End Code AD Chart Line
Advance/Decline as Label on chart
# 10:14 Mobius: here is an AD label that includes the open, high and low of the day with bubbles plotted at those price locations on the chart.
Code:# AD Label # Mobius # V01 def RTH = getTime() >= regularTradingStart(getYYYYMMDD()) and getTime() <= regularTradingEnd(getYYYYMMDD()); def o = if RTH and !RTH[1] then open("$ADSPD") else o[1]; def c = if isNaN(close("$ADSPD")) then c[1] else close("$ADSPD"); def x = barNumber(); def sumx = if RTH and !RTH[1] then 1 else if RTH then sumx[1] + 1 else if !RTH then sumx[1] else sumx[1]; def sumAD = if RTH and !RTH[1] then c else if RTH then sumAD[1] + c else sumAD[1]; def h = if isNaN(high("$ADSPD", "DAY")) then h[1] else high("$ADSPD", "DAY"); def ADHighBar = if high("$ADSPD") == h then x else double.nan; AddChartBubble(barNumber() == HighestAll(ADHighBar), high + (2 * TickSize()), "AD", color.cyan); def l = if isNaN(low("$ADSPD", "DAY")) then l[1] else low("$ADSPD", "DAY"); def ADLowBar = if low("$ADSPD") == l then x else double.nan; AddChartBubble(barNumber() == HighestAll(ADLowBar), low - (2 * TickSize()), "AD", color.orange, no); def Avg = Round(sumAD / sumx, 0); addLabel(1, "AD open " + o + " high " + h + " low " + l + " close " + c + " Avg " + Avg, if c < 0 then color.red else color.green); # End Code AD Label
Code # 2 of 3
#10:18 Mobius: Here's AD Scaled to Price and plotted along with a plot of the AD zero line at price where crosses. Which is often a price pivot area.
Code:# AD Scaled To Price # Mobius # Changed original code to use RegularTrading(Start, End) functions. Use RTH Only. # V02 2019 script Scale { input h = high; input l = low; input c = close; def RTH = getTime() >= RegularTradingStart(getYYYYMMDD()) and getTime() <= RegularTradingEnd(getYYYYMMDD()); def max = if RTH and !RTH[1] then high else if RTH and high > max[1] then high else max[1]; def min = if RTH and !RTH[1] then low else if RTH and low < min[1] then low else min[1]; def hh = if RTH and !RTH[1] then h else if RTH and h > hh[1] then h else hh[1]; def ll = if RTH and !RTH[1] then l else if RTH and l < ll[1] then l else ll[1]; plot Range = (((Max - Min) * (c - ll)) / (hh - ll)) + Min; } plot Scaled_Symbol = scale(high("$ADSPD"), low("$ADSPD"), close("$ADSPD")); Scaled_Symbol.AssignValueColor(if Scaled_Symbol > Scaled_Symbol[1] then color.green else color.red); Scaled_Symbol.SetLineWeight(2); Scaled_Symbol.HideBubble(); Scaled_Symbol.HideTitle(); def zero = if close("$ADSPD") crosses 0 then close else zero[1]; def zero_bar = if close("$ADSPD") crosses 0 then barNumber() else double.nan; plot zeroLine = if barNumber() >= highestAll(zero_bar) then highestAll(if isNaN(close[-1]) then zero else double.nan) else double.nan; zeroLine.SetDefaultColor(Color.Light_Gray); zeroLine.SetStyle(Curve.Points); zeroLine.SetLineWeight(2); zeroLine.HideBubble(); zeroLine.HideTitle(); AddChartBubble(barNumber() == HighestAll(barNumber()), zeroLine, "AD 0", zeroLine.TakeValueColor()); # End Code
#10:22 MTS1: Thanks Mobius!
#10:26 binh4984: Thank you very much Mobius for your help.
#10:33 Mobius: yw And, bin... you might consider the fact that AD is an oscillator that ranges around 0. So taking a daily average of it's closing value would be that same as taking the daily closing average of any oscillator
#10:35 Mobius: won't tell you anything of value. Now you could write a binary momentum indicator using AD on a daily basis that would tell you when a trend is in place and the momentum of that trend
#10:36 Mobius: See the True Momentum Indicator for a method to do that and adding a weight adjusted by the closing value of AD might be useful
#10:37 MTS1: I guess an average on a cumulative AD could be some sort of signal line. I know some analysts look at longer term MI's like that, also # stocks above or below an MA, new highs/lows etc. But I think AD / VOLD etc are probably more useful intraday.
(I would not endorse #3 of 3 as I don't see it's utility: markos)
Cumulative AD
Code:#10:42 Mobius: # Cumulative AD declare lower; plot Data = TotalSum(close("$ADSPD")); plot "0" = 0; #EOC#
Is there a way to scale & plot the Previous Day's Close from any symbol onto the current chart? I've tried editing this script but haven't been successful. For example, I'd like to see the Previous Day Close of various symbols scaled & plotted on ES. Thanks in advance for anyone who can assist!
| Thread starter | Similar threads | Forum | Replies | Date |
|---|---|---|---|---|
|
|
Weighted Advance/Decline For ThinkOrSwim | Indicators | 99 | |
| P | Current Price Line Indicator For ThinkOrSwim | Indicators | 25 | |
|
|
Short/Long Entry Line on Chart for ThinkorSwim | Indicators | 3 |
Similar threads
Not the exact question you're looking for?
Start a new thread and receive assistance from our community.
87k+
Posts
287
Online
Similar threads
Similar threads
The Market Trading Game Changer
Join 2,500+ subscribers inside the useThinkScript VIP Membership Club
- Exclusive indicators
- Proven strategies & setups
- Private Discord community
- ‘Buy The Dip’ signal alerts
- Exclusive members-only content
- Add-ons and resources
- 1 full year of unlimited support
Frequently Asked Questions
What is useThinkScript?
useThinkScript is the #1 community of stock market investors using indicators and other tools to power their trading strategies. Traders of all skill levels use our forums to learn about scripting and indicators, help each other, and discover new ways to gain an edge in the markets.
How do I get started?
We get it. Our forum can be intimidating, if not overwhelming. With thousands of topics, tens of thousands of posts, our community has created an incredibly deep knowledge base for stock traders. No one can ever exhaust every resource provided on our site.
If you are new, or just looking for guidance, here are some helpful links to get you started.
- The most viewed thread:
https://usethinkscript.com/threads/repainting-trend-reversal-for-thinkorswim.183/ - Our most popular indicator:
https://usethinkscript.com/threads/buy-the-dip-indicator-for-thinkorswim.3553/ - Answers to frequently asked questions:
https://usethinkscript.com/threads/answers-to-commonly-asked-questions.6006/
What are the benefits of VIP Membership?
VIP members get exclusive access to these proven and tested premium indicators: Buy the Dip, Advanced Market Moves 2.0, Take Profit, and Volatility Trading Range. In addition, VIP members get access to over 50 VIP-only custom indicators, add-ons, and strategies, private VIP-only forums, private Discord channel to discuss trades and strategies in real-time, customer support, trade alerts, and much more. Learn all about VIP membership here.
How can I access the premium indicators?
To access the premium indicators, which are plug and play ready, sign up for VIP membership here.