34-EMA Wave and GRaB Candles Indicator for ThinkorSwim

Rather than have multiple versions, my offering is a slight modification of the original, with selectable moving average type and length. http://tos.mx/kCS5Kr2
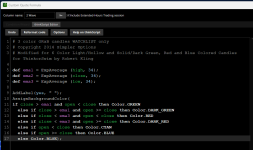
Code:
# 3 color GRaB candles for ThinkorSwim
# Copyright 2014 Simpler Options
#
# Credit: Raghee Horner
#
# V1.01  Robert Kling  Modified for 6 Color Light/Hollow and Solid/Dark Green, Red and Blue Colored Candles for ThinkorSwim
#
#  The original EMA GRaB indicator produced a wave consists of:
#     The high of 34 period exponential moving average
#     The low of 34 period exponential moving average
#     The close of 34 period exponential moving average
#
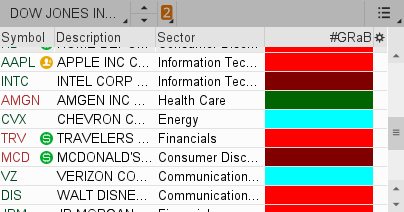
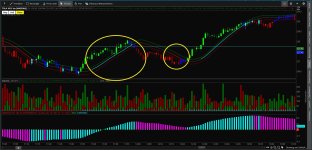
#  The 34-EMA GRaB indicator helps to identify the following:
#     Uptrend market (green)
#     Downtrend market (red)
#     Sideways market (blue)
#
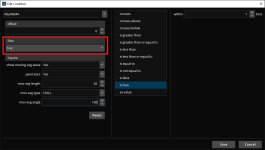
# V1.02  [USER=8847]@VernT[/USER]  modified to allow any moving average type and length.  These are now inputs.
#
#
declare upper;
declare once_per_bar;

input avgType = AverageType.Exponential;
input avgLength = 34;

Plot avg1 = MovingAverage(avgType, high, avgLength);
plot avg2 = MovingAverage(avgType, close, avgLength);
plot avg3 = MovingAverage(avgType, low, avgLength);

avg1.SetDefaultColor(Color.GREEN);
avg1.SetLineWeight(2);
avg2.SetDefaultColor(Color.BLUE);
avg2.SetLineWeight(2);
avg3.SetDefaultColor(Color.RED);
avg3.SetLineWeight(2);

AssignPriceColor(if close > avg1 and open < close then Color.GREEN
  else if close > avg1 and open >= close then Color.DARK_GREEN
  else if close < avg3 and open < close then Color.RED
  else if close < avg3 and open >= close then Color.DARK_RED
  else if open < close then Color.CYAN
  else if open >= close then Color.BLUE
  else Color.BLUE);
 

New Indicator: Buy the Dip

Check out our Buy the Dip indicator and see how it can help you find profitable swing trading ideas. Scanner, watchlist columns, and add-ons are included.

Download the indicator

Hey All, long time lurker, first time poster here.

I am tinkering with a strategy based on Raghee Horner's 34 EMA Wave, and one of the criteria she specifies is that the slope of the 34 EMA should be in a "12 o' clock to 2 o' clock" position.

Based on this info, I was able to scrap together an indicator that (I believe) changes the plot color once the slope reaches the angle she describes.
However, I've wasted more hours than I'm willing to admit trying to create a scan which shows only stocks whose 34 EMAs fit within this slope criteria.

I've included the code below to show how the slope is calculated.
Thanks so much, to all you crafty people who generously contribute your time and energy to helping us code-illiterates.

declare lower;

input length = 34;
input price = close;
input averageType = AverageType. Exponential;
def avg = MovingAverage(averageType, price, length);
def height = avg - avg[1];
plot “Angle, deg” = Atan(height/length) * 180 / Double.Pi;
“Angle, deg”.AssignValueColor (if “Angle, deg” >=.833333333 then color.ORANGE else color.BLack);
 
@shrewdlybullish You're almost there... For scanning you want to only have the plot be true if the angle meets the criteria...

Ruby:
plot data = if (Atan(height / length) * 180 / Double.Pi) then 1 else Double.NaN;

Not tested but should be correct... Also, try to avoid using variables or plot names within quotes when at all possible... It makes debugging a whole lot easier...
@rad14733 thanks so much for taking a crack at this!

I tried to convert it into a scan using the following, but got no matches. Any clue where I deviated?
input length = 34;

input price = close;
input averageType = AverageType. Exponential;
def avg = MovingAverage(averageType, price, length);
def height = avg - avg[1];

plot “Angle, deg” = if (Atan(height / length) * 180 / Double.Pi) >=.833333333 then 1 else Double.NaN;
 
@shrewdlybullish I just set the timeframe to 1m and got the following results... That tells me that you need to make adjustments to timeframe and/or length until you get the desired results...

IjE3Fcs.png
 
@rad14733 that actually makes a ton of sense, and I can understand and appreciate why you're saying it.

I realized that I had an extra criteria (Last price) that was preventing me from getting results. Thanks again!
 
Last edited:
Is it possible to create a watchlist along with bar color coating?

Basically I just want to create a watchlist of my daily picks and have the watchlist show what color candle its currently on.
 
Is it possible to create a watchlist along with bar color coating?

Basically I just want to create a watchlist of my daily picks and have the watchlist show what color candle its currently on.
GRaB Watchlist
shared watchlist column script: http://tos.mx/JqJrWI1 Click here for --> Easiest way to load shared links
IrcvwLx.png

Ruby:
# 3 color GRaB candles WATCHLIST only
# Copyright 2014 Simpler Options
# Modified for 6 Color Light/Hollow and Solid/Dark Green, Red and Blue Colored Candles for ThinkorSwim by Robert Kling

def ema1 = ExpAverage (high, 34);
def ema2 = ExpAverage (close, 34);
def ema3 = ExpAverage (low, 34);

AddLabel(yes, " ");
AssignBackgroundColor(
if close > ema1 and open < close then Color.GREEN
  else if close > ema1 and open >= close then Color.DARK_GREEN
  else if close < ema3 and open < close then Color.RED
  else if close < ema3 and open >= close then Color.DARK_RED
  else if open < close then Color.CYAN
  else if open >= close then Color.BLUE
  else Color.BLUE);
Thanks J.What time frame does this work?
 
Hey All, long time lurker, first time poster here.

I am tinkering with a strategy based on Raghee Horner's 34 EMA Wave, and one of the criteria she specifies is that the slope of the 34 EMA should be in a "12 o' clock to 2 o' clock" position.

Based on this info, I was able to scrap together an indicator that (I believe) changes the plot color once the slope reaches the angle she describes.
However, I've wasted more hours than I'm willing to admit trying to create a scan which shows only stocks whose 34 EMAs fit within this slope criteria.

I've included the code below to show how the slope is calculated.
Thanks so much, to all you crafty people who generously contribute your time and energy to helping us code-illiterates.

declare lower;

input length = 34;
input price = close;
input averageType = AverageType. Exponential;
def avg = MovingAverage(averageType, price, length);
def height = avg - avg[1];
plot “Angle, deg” = Atan(height/length) * 180 / Double.Pi;
“Angle, deg”.AssignValueColor (if “Angle, deg” >=.833333333 then color.ORANGE else color.BLack);


I like the idea of using angles for confirmation. Try this .. it allows you to adjust the angle threshold. I personally use a 20 HULL moving average with a 150 angle.

Ruby:
declare upper;

input ShowMovingAvgWave      = yes;
input PaintBars              = yes;
input MovAvg_Length          = 34;
input MovAvg_Type            = AverageType.EXPONENTIAL;
input MovAvg_Angle           = 75;

plot ma1   = MovingAverage (MovAvg_Type, high, MovAvg_Length);
plot ma2   = MovingAverage (MovAvg_Type, close, MovAvg_Length);
plot ma3   = MovingAverage (MovAvg_Type, low, MovAvg_Length);
def height = ma2 - ma2[1];
def Angle  = Atan(height/50) * 180 / Double.Pi;
ma1.SetDefaultColor(Color.DARK_GREEN);
ma1.SetLineWeight(2);
ma1.SetHiding(!ShowMovingAvgWave);
ma2.SetDefaultColor(Color.DARK_GRAY);
ma2.SetLineWeight(2);
ma2.SetHiding(!ShowMovingAvgWave);
ma2.AssignValueColor (if Angle >= MovAvg_Angle/1000 or Angle <= -(MovAvg_Angle/1000) then
                                          if Angle < 0 then Color.Red else color.CYAN
                                      else Color.DARK_GRAY);
ma3.SetDefaultColor(Color.DARK_RED);
ma3.SetLineWeight(2);
ma3.SetHiding(!ShowMovingAvgWave);

AssignPriceColor(if PaintBars  then if close > ma1 and open < close then Color.GREEN
  else if close > ma1 and open >= close  then Color.DARK_GREEN
  else if close < ma3 and open < close  then Color.RED
  else if close < ma3 and open >= close  then Color.DARK_RED
  else if open < close  then Color.CYAN
  else if open >= close then Color.BLUE
  else Color.BLUE
  else Color.Current);
 

Attachments

  • MA Angle.jpg
    MA Angle.jpg
    227.2 KB · Views: 139
Last edited:
I like the idea of using angles for confirmation. Try this .. it allows you to adjust the angle threshold. I personally use a 20 HULL moving average with a 150 angle.

Ruby:
declare upper;

input ShowMovingAvgWave      = yes;
input PaintBars              = yes;
input MovAvg_Length          = 34;
input MovAvg_Type            = AverageType.EXPONENTIAL;
input MovAvg_Angle           = 75;

plot ma1   = MovingAverage (MovAvg_Type, high, MovAvg_Length);
plot ma2   = MovingAverage (MovAvg_Type, close, MovAvg_Length);
plot ma3   = MovingAverage (MovAvg_Type, low, MovAvg_Length);
def height = ma2 - ma2[1];
def Angle  = Atan(height/50) * 180 / Double.Pi;
ma1.SetDefaultColor(Color.DARK_GREEN);
ma1.SetLineWeight(2);
ma1.SetHiding(!ShowMovingAvgWave);
ma2.SetDefaultColor(Color.DARK_GRAY);
ma2.SetLineWeight(2);
ma2.SetHiding(!ShowMovingAvgWave);
ma2.AssignValueColor (if Angle >= MovAvg_Angle/1000 or Angle <= -(MovAvg_Angle/1000) then
                                          if Angle < 0 then Color.Red else color.CYAN
                                      else Color.DARK_GRAY);
ma3.SetDefaultColor(Color.DARK_RED);
ma3.SetLineWeight(2);
ma3.SetHiding(!ShowMovingAvgWave);

AssignPriceColor(if PaintBars  then if close > ma1 and open < close then Color.GREEN
  else if close > ma1 and open >= close  then Color.DARK_GREEN
  else if close < ma3 and open < close  then Color.RED
  else if close < ma3 and open >= close  then Color.DARK_RED
  else if open < close  then Color.CYAN
  else if open >= close then Color.BLUE
  else Color.BLUE
  else Color.Current);
this is cool. thank you for sharing inspiration. loaded and watching it. trying scanning on MA2 set to hull (20) and angle (150) produced a nice match . @dap711 am I scanning the correct thing. TY again
 
Last edited:
this is cool. thank you for sharing inspiration. loaded and watching it. trying scanning on MA2 set to hull (20) and angle (150) produced a nice match . @dap711 am I scanning the correct thing. TY again

Add this code to the bottom of the study.
Ruby:
plot buy = Angle > MovAvg_Angle/1000 and Angle > 0;
buy.sethiding(yes);
plot sell = Angle < MovAvg_Angle/1000 and Angle < 0;
sell.sethiding(yes);

Create a new scan and add the study:
 

Attachments

  • 34EMA Buy Scan.jpg
    34EMA Buy Scan.jpg
    81.8 KB · Views: 51
  • 34EMA Sell Scan.jpg
    34EMA Sell Scan.jpg
    81.5 KB · Views: 54

BenTen's Watchlist + Setup + Trade Recaps

Get access to Ben's watchlist, swing trading strategy, ThinkorSwim setup, and trade examples.

Learn more

Similar threads

Not the exact question you're looking for?

Start a new thread and receive assistance from our community.

87k+ Posts
538 Online
Create Post

Similar threads

Similar threads

The Market Trading Game Changer

Join 2,500+ subscribers inside the useThinkScript VIP Membership Club
  • Exclusive indicators
  • Proven strategies & setups
  • Private Discord community
  • ‘Buy The Dip’ signal alerts
  • Exclusive members-only content
  • Add-ons and resources
  • 1 full year of unlimited support

Frequently Asked Questions

What is useThinkScript?

useThinkScript is the #1 community of stock market investors using indicators and other tools to power their trading strategies. Traders of all skill levels use our forums to learn about scripting and indicators, help each other, and discover new ways to gain an edge in the markets.

How do I get started?

We get it. Our forum can be intimidating, if not overwhelming. With thousands of topics, tens of thousands of posts, our community has created an incredibly deep knowledge base for stock traders. No one can ever exhaust every resource provided on our site.

If you are new, or just looking for guidance, here are some helpful links to get you started.

What are the benefits of VIP Membership?
VIP members get exclusive access to these proven and tested premium indicators: Buy the Dip, Advanced Market Moves 2.0, Take Profit, and Volatility Trading Range. In addition, VIP members get access to over 50 VIP-only custom indicators, add-ons, and strategies, private VIP-only forums, private Discord channel to discuss trades and strategies in real-time, customer support, trade alerts, and much more. Learn all about VIP membership here.
How can I access the premium indicators?
To access the premium indicators, which are plug and play ready, sign up for VIP membership here.
Back
Top