



Scroll down to check out this week's must reads, carefully selected by uTS Moderators!

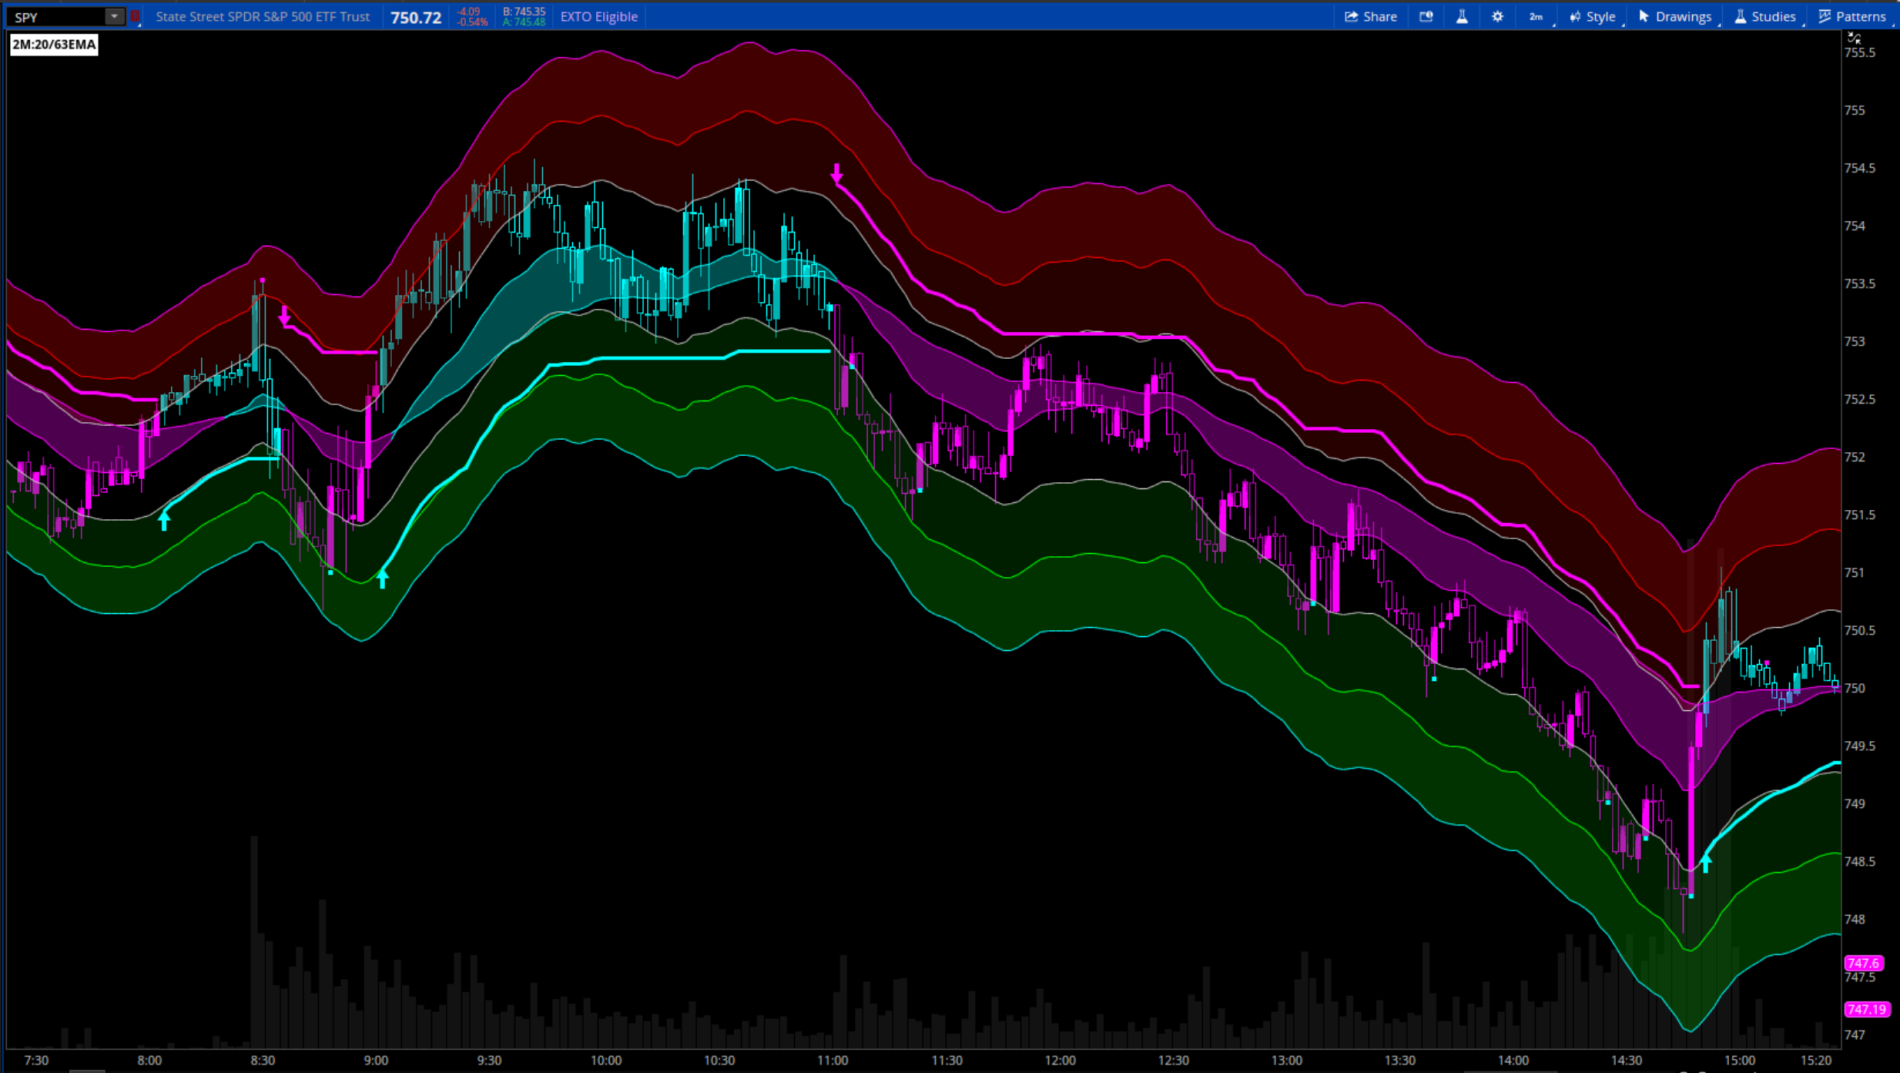
Uptrick: Vector Trail Trend
chewie76 said:This indicator shows overall trend, plots points where trend is weakening, and bands where price is extended with a likelihood of a reversal. Many of the visual features are inputs and can be turned on/off in the settings.
VTT is a trend-following overlay built around a smoothed, velocity-projected moving average (the “Vector Trend Engine”), wrapped in an ATR-based volatility trail that flips between support and resistance as the trend changes. Layered on top are a secondary trend-confirmation ribbon, a momentum-based take-profit signal, and a set of graduated volatility bands that frame the broader move. The goal is to give a trader one glance at: direction, confirmation, and how stretched the move currently is.
Read more:
https://usethinkscript.com/threads/uptrick-vector-trail-trend-for-thinkorswim.22567/
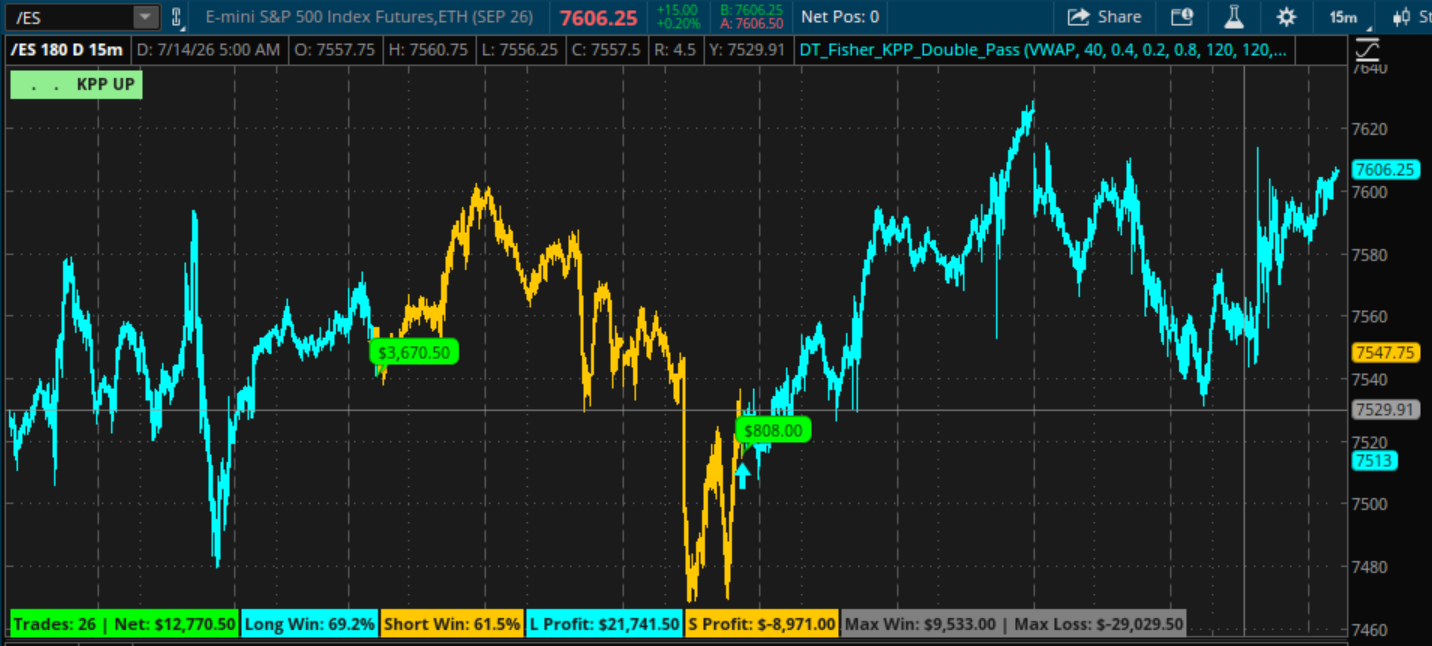
Fisher-KPP Double-Pass Smoothed Wave Indicator
whoDAT said:The Fisher-KPP Double-Pass Smoothed Wave indicator is an advanced, non-linear trend-following and mean-reversion algorithm designed for the Thinkorswim (TOS) platform. By combining partial differential equations (PDEs) from physical chemistry and biology with a high-performance backtesting engine, this system is designed to model, filter, and trade macro price waves.
Read more:
https://usethinkscript.com/threads/...moothed-wave-indicator-for-thinkorswim.22563/
VIP SUBSCRIBERS ONLY |
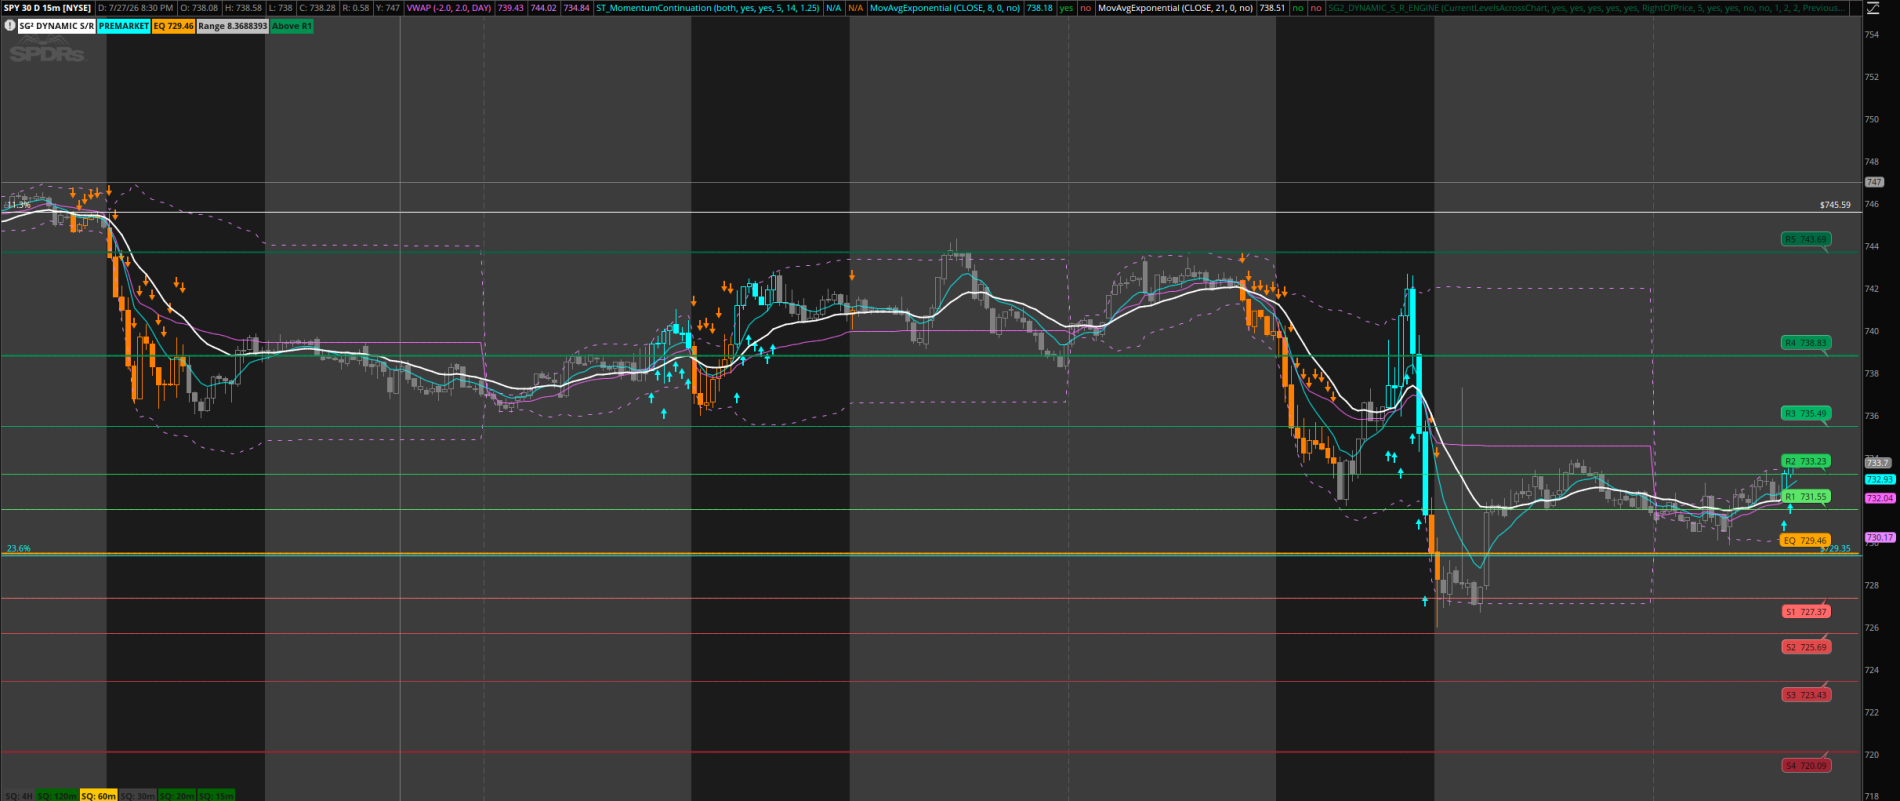
MTF SG² Volatility-Adjusted Support and Resistance
Ajordan930 said:SG² Dynamic Support & Resistance Engine
After looking at other support and resistance tools I created a hybrid that focuses on equilibrium.
The SG² Dynamic Support & Resistance Engine is a volatility-adaptive support and resistance model that generates a structured ladder of price levels from a daily equilibrium rather than relying on traditional pivot calculations. The equilibrium is derived from a configurable anchor, such as the previous day's close, HLC3, midpoint, or current session open, while the spacing between levels is determined using a hybrid volatility model that combines Average True Range (ATR), Average Daily Range (ADR), and an optional overnight gap adjustment. Nonlinear multipliers compress levels closer to equilibrium and progressively expand them farther away, producing a hierarchy of support and resistance zones that better reflects the way markets naturally accelerate and decelerate around key price areas.
Unlike conventional daily pivot indicators, the SG² engine continuously projects the current trading day's levels across the entire intraday chart and maintains them throughout premarket, regular trading hours, post market, and the chart's right-side expansion area. All levels are automatically rounded to the instrument's native tick size, with optional historical daily mode available for reviewing previous sessions independently. The result is a stable institutional-style price framework that provides traders with clearly defined equilibrium, support, and resistance levels for identifying potential reversal zones, breakout targets, trend continuation areas, and risk management reference points throughout the entire trading session.
Read more
For VIP: https://usethinkscript.com/threads/mtf-sg²-volatility-adjusted-support-and-resistance.22590/
Join our VIP Members Club to get access to our premium indicators including Buy The Dip, Advanced Market Moves and Take Profit.
Your VIP membership includes:
✓Full access to public & private forums
✓No Ads
✓Priority community support
✓Unlimited Postings
✓Premium thinkorswim indicators
✓Exclusive strategies, scanners, add-ons
✓Discord chatroom with Trade Alerts
VIP Membership
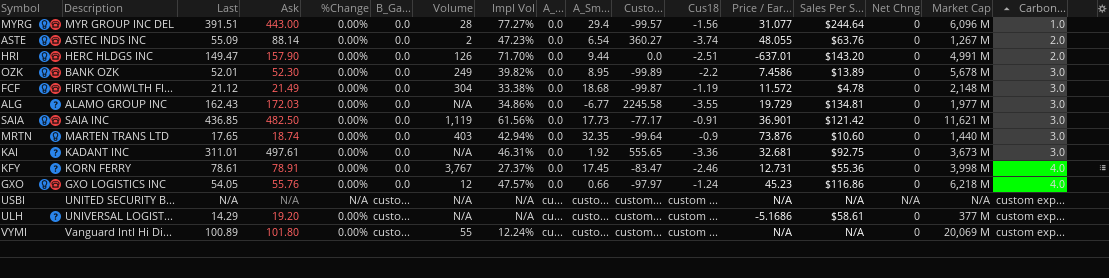
CarbonStation Score Column
Adeodatus shared:This indicator highlights the stocks that institutions are most likely to be accumulating.
Institutional money typically flows into stocks leading their sector with strong relative strength, healthy volume, expanding price action, and established trends.
Read more:
https://usethinkscript.com/threads/carbonstation-score-column-for-thinkorswim.22572/
FROM THE ARCHIVES |
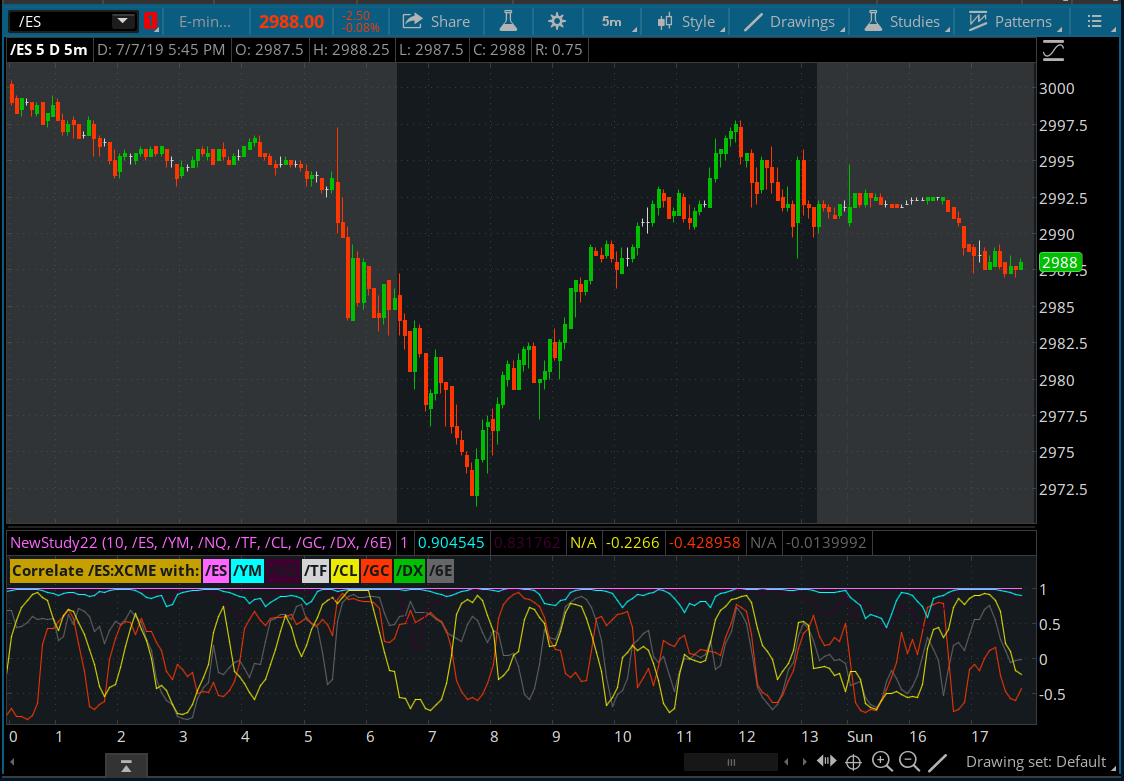
Futures Correlation Indicator
BenTen shared:This indicator does not attempt to forecast price. Instead, it quantifies the historical relationship between markets. Because intermarket correlations are generally persistent over time, it helps traders learn which markets typically move together, which move inversely, and when those relationships are strengthening or weakening.
Its greatest value is educational—developing an understanding of market structure and intermarket behavior, which is a foundational skill of consistently profitable traders.
Read more
https://usethinkscript.com/threads/futures-correlation-indicator-for-thinkorswim.308/
Last edited:

