



Scroll down to check out this week's must reads, carefully selected by uTS Moderators!

AGAIG 0DTE Buy or Sell Iron Fly for Profit
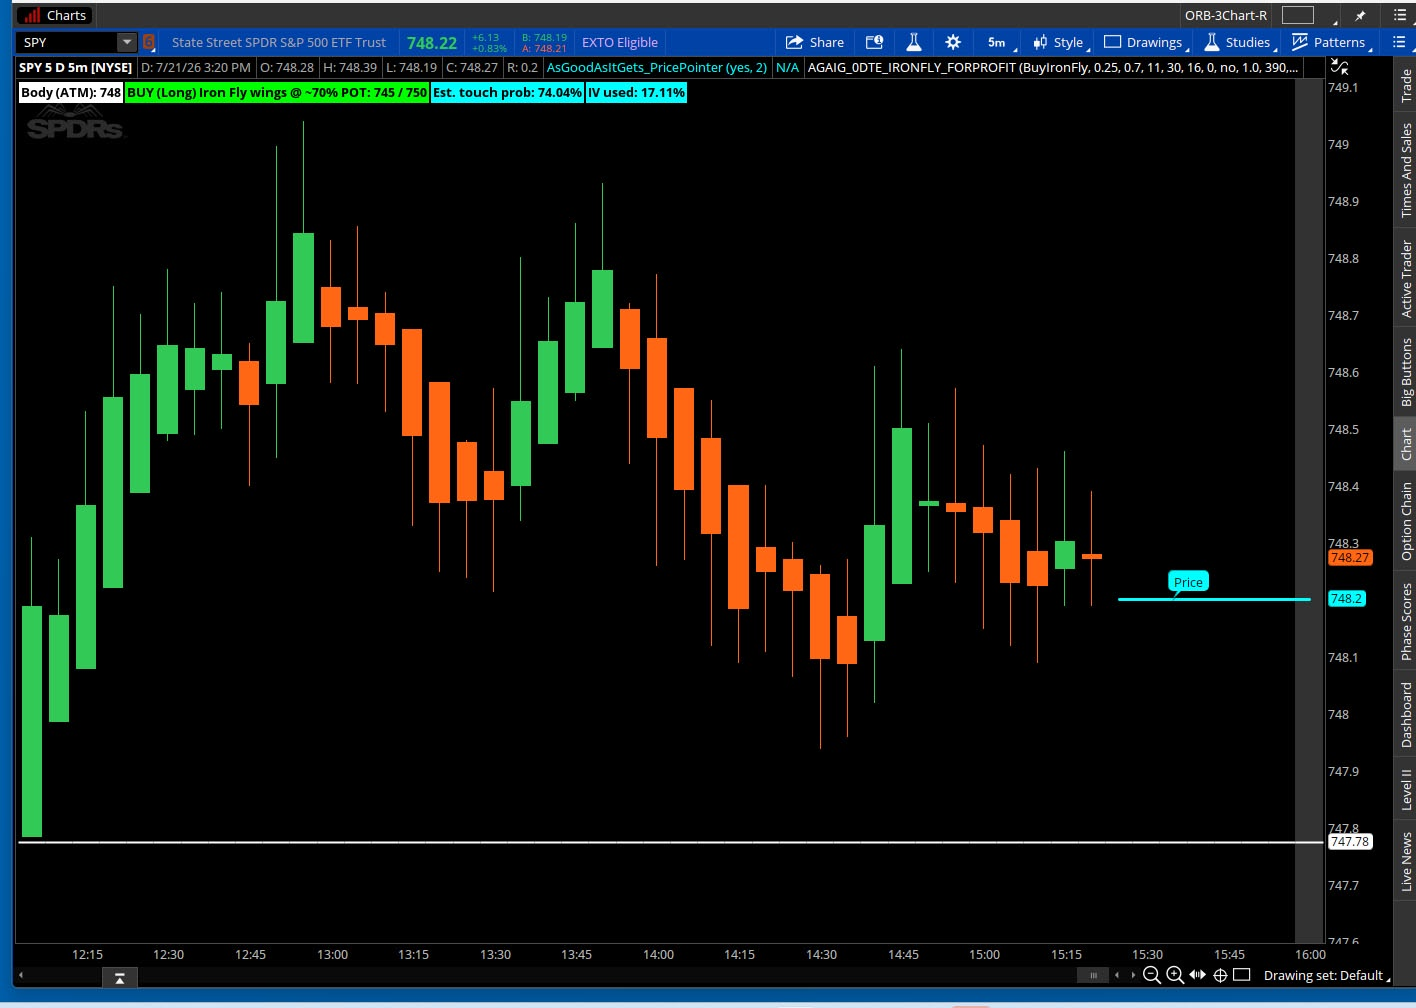
csricksdds said:An 11:30 AM entry, math-driven instead of eyeballed. The indicator pulls implied volatility and time left to close, then solves for the exact strike distance matching your target probability of touch — no guessing where to set wings.
Why 11:30? Opening volatility has settled, but there's still enough time value left to make selling premium worthwhile.
Why probability of touch, not just the expected move? The raw one-sigma "market maker move" tells you where price usually lands, but it's not tied to your risk tolerance. Setting wings by touch probability lets you choose that directly — 25% on the sell side buys real room before a wing gets tested, versus the ~32% you'd get from a plain one-sigma wing by default.
Two-sided. Toggle Sell (short iron fly, collect credit, profit if price stays inside) or Buy (long iron fly, pay debit, profit if price reaches a wing) — same math, opposite intent, each with its own target probability.
Built-in GTC calculator. Enter your actual fill, get the exact limit price for a 35% profit target. No mental math mid-session.
The edge is discipline. A hard 35% target plus a defined late-day exit turns a probability edge into consistent, bankable results — instead of letting winners ride into risk.
Read more:
https://usethinkscript.com/threads/agaig-0dte-buy-or-sell-iron-fly-for-profit-for-thinkorwim.22575/
Wave Projection Bands
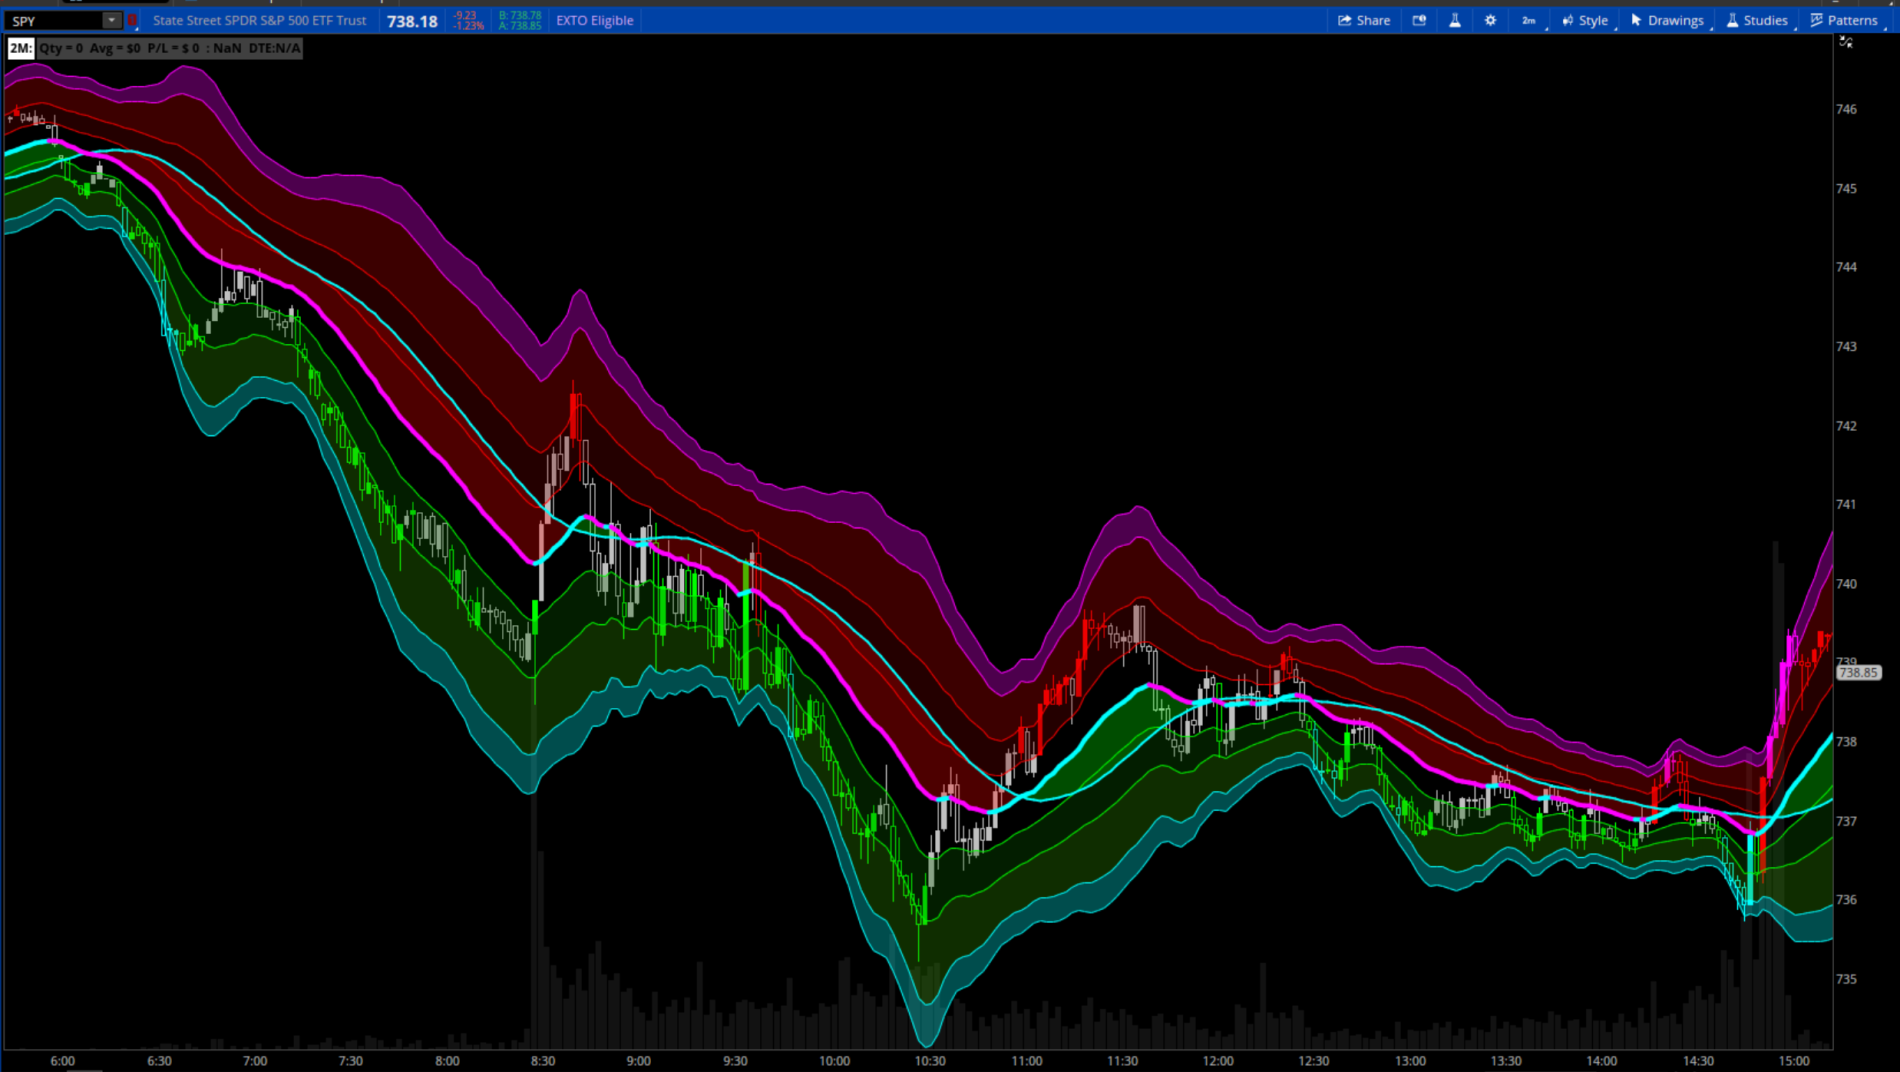
chewie76 said:The Wave Projection Bands indicator transforms the traditional WaveTrend oscillator into a dynamic price overlay, projecting momentum and overbought/oversold zones directly onto the price chart.
Rather than forcing traders to constantly compare price action with a lower-panel oscillator, the indicator converts oscillator values into adaptive price bands surrounding a projected trend centerline. This creates a visual map showing where WaveTrend considers price to be statistically stretched or compressed in real time.
At its core is a smoothed adaptive centerline that represents the market's current equilibrium. Around this equilibrium, multiple dynamic bands expand and contract with changing market volatility using WaveTrend's channel calculations. As volatility increases, the bands naturally widen. During quieter conditions they contract, providing proportional price targets regardless of market regime.
Read more:
https://usethinkscript.com/threads/wave-projection-bands-for-thinkorswim.22581/
VIP SUBSCRIBERS ONLY |
Trading Stoch Engine with lbr310
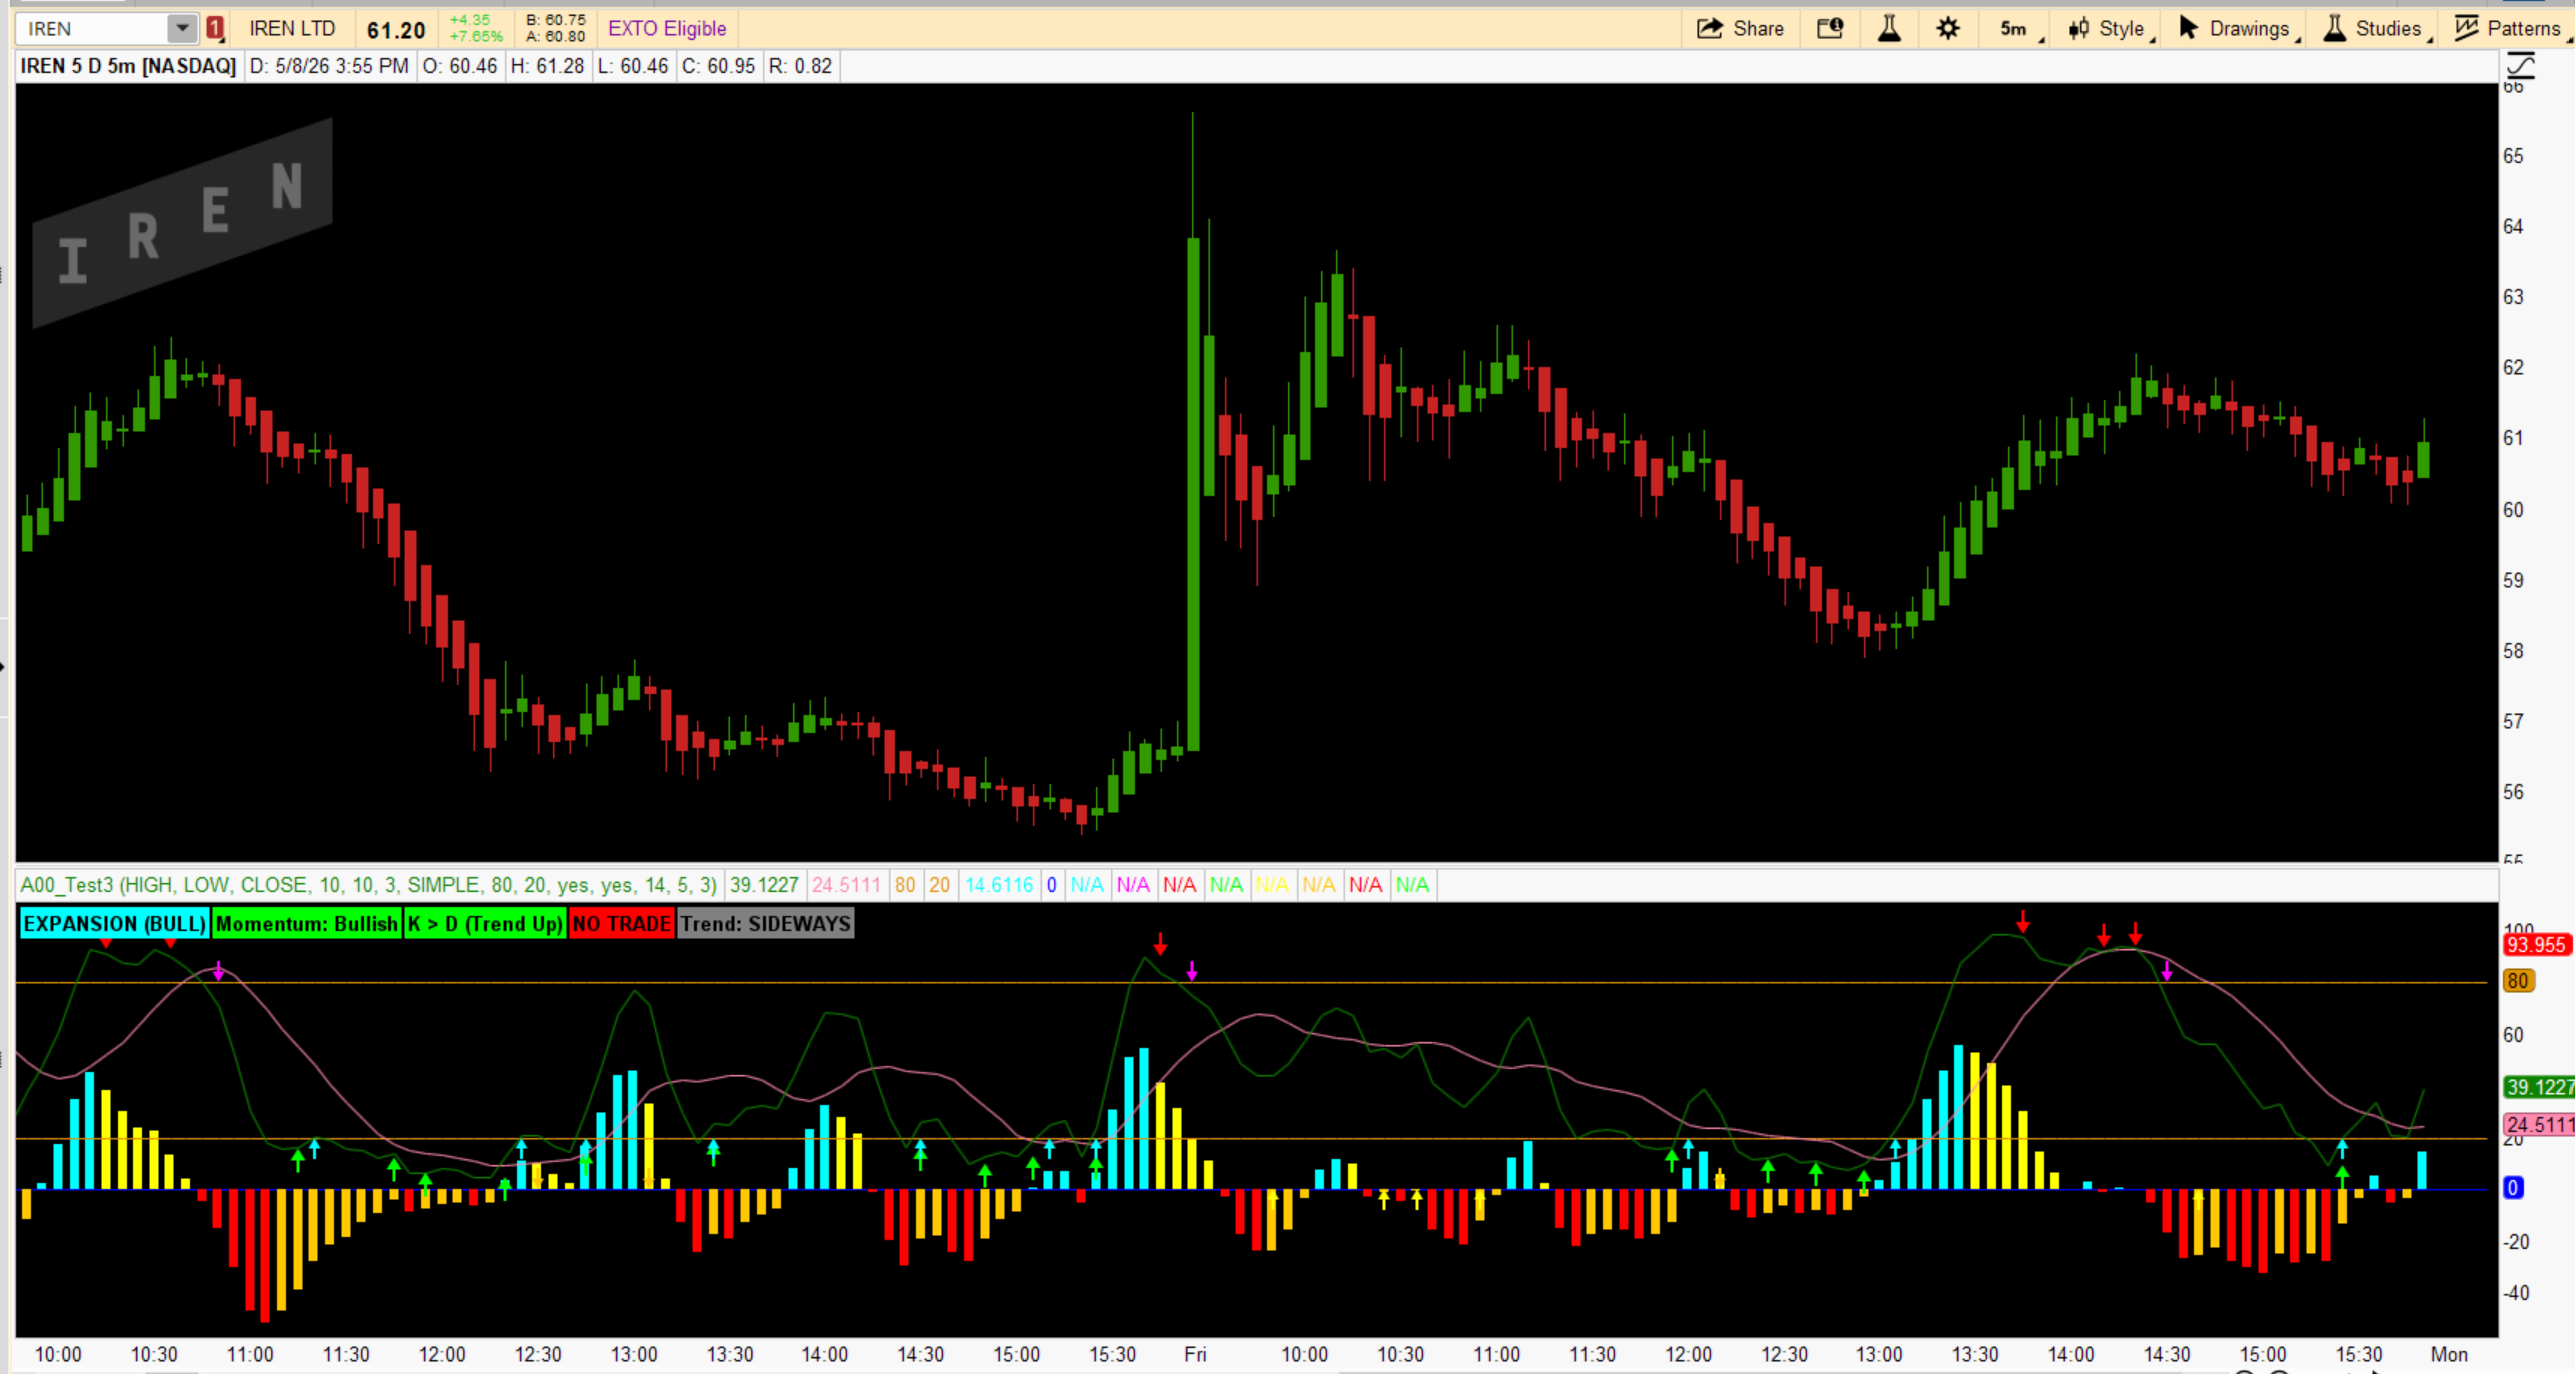
antwerks said:This indicator is a multi-layer momentum and timing system built around a modified stochastic oscillator, a momentum histogram, trend context using moving averages, and a “first cross” trigger derived from an LBR-style signal. Its purpose is not just to show overbought or oversold conditions, but to classify market conditions, identify high-probability setups, and clearly signal when to act versus when to wait.
At its core, the indicator uses a smoothed stochastic (%K and %D) to track where price is trading within its recent range. When the stochastic moves into extreme zones (above 80 or below 20), it signals that price may be stretched. However, instead of blindly trading these extremes, the system adds peak and turning-point detection, which marks when momentum is actually beginning to reverse. These peak arrows are best used at the edges of a range or after an extended move, not in the middle of choppy price action.
A key component is the momentum histogram (FullK – FullD), which acts as an early warning system. When the histogram shifts from red to green, it indicates momentum is turning upward; when it shifts from green to red, momentum is turning downward. Strong, expanding bars suggest increasing momentum, while shrinking bars warn of slowing movement. This helps the user anticipate moves before they fully develop.
Read more
https://usethinkscript.com/threads/trading-stoch-engine-with-lbr310.22368/
Join our VIP Members Club to get access to our premium indicators including Buy The Dip, Advanced Market Moves and Take Profit.
Your VIP membership includes:
✓Full access to public & private forums
✓No Ads
✓Priority community support
✓Unlimited Postings
✓Premium thinkorswim indicators
✓Exclusive strategies, scanners, add-ons
✓Discord chatroom with Trade Alerts
VIP Membership
Modified Order Block Detector
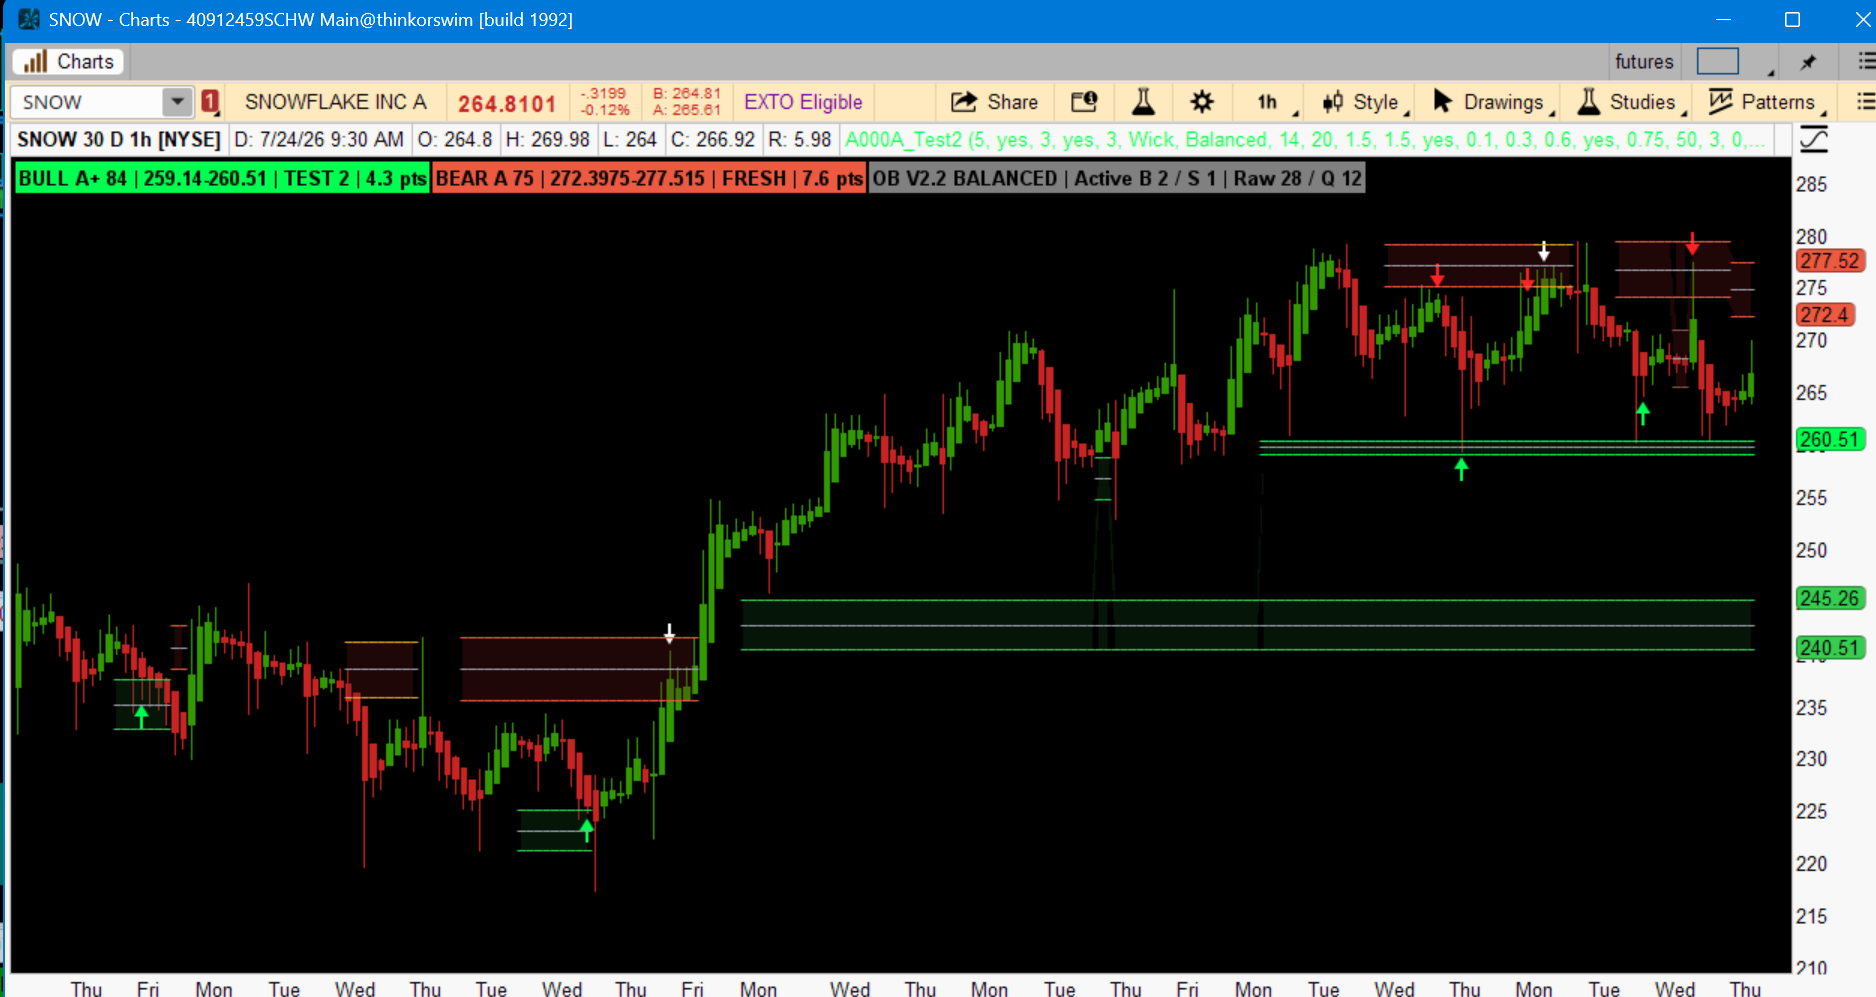
Adeodatus shared:One of the greatest challenges traders face is deciding which support and resistance levels deserve their attention. This indicator attempts to reduce that clutter by highlighting only those price areas that exhibit characteristics commonly associated with institutional participation.
Rather than treating every block equally; the quality engine scores each block based on
▸ relative volume
▸ displacement
▸ zone width
▸ origin candle
▸ freshness
Read more:
https://usethinkscript.com/threads/modified-order-block-detector-luxalgo-for-thinkorswim.22582/
FROM THE ARCHIVES |
Awesome Oscillator (AO) Divergence Indicator
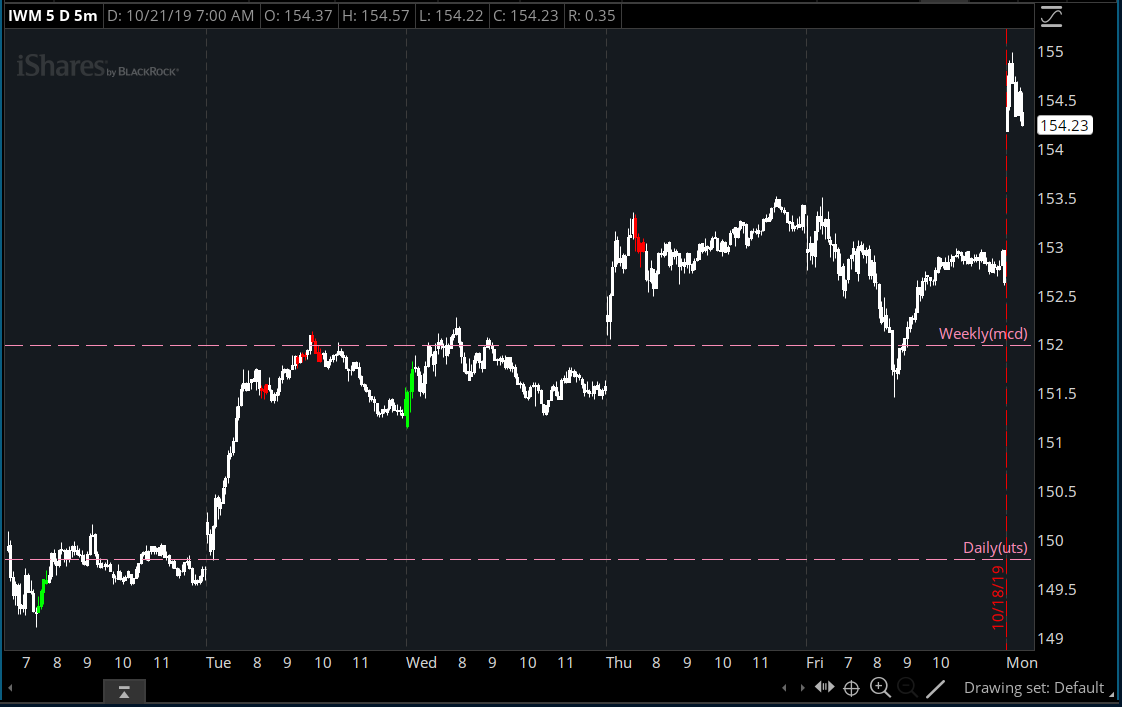
BenTen shared:This indicator paints your candlesticks when a bullish divergence is found on both the RSI and the Awesome Oscillator and red when bearish divergence is found.
Most divergence indicators look amazing in hindsight because they are repainters. They wait for future pivots, then go back and paint perfect signals on old candles. This one doesn't. It evaluates only the information available at the current bar, so once a candle closes its signal is locked in. That makes it a much more honest tool for live trading.
For day traders, divergence can be an early clue that momentum is fading before price actually reverses. It won't predict every turn, but it can help identify exhaustion and keep you from chasing moves that are already running out of steam. Used alongside your existing strategy, it adds another piece of context without rewriting history.
Read more
https://usethinkscript.com/threads/awesome-oscillator-ao-divergence-indicator-for-thinkorswim.887/
Last edited:

