Trend Magic MultiTime Frame Indicator for ThinkorSwim

horserider

Well-known member
VIP
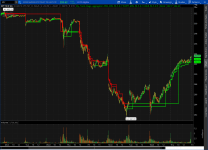
Updated Trend Magic indicator to include 3 user selected time frames.

Code:
# Trend Magic MultiTime Frame
#Update to original Trend Magic adding multiTime Frames
#Horserider 8/8/2019


input agg = AggregationPeriod.FIFTEEN_MIN;
def c = close(period = agg);
def h = high(period = agg);
def l = low(period = agg);
def pricedata = hl2(period = agg);

DefineGlobalColor("TrendUp", CreateColor(0, 254, 30));
DefineGlobalColor("TrendDown", CreateColor(255, 3, 2));


input lengthCCI = 50;
input lengthATR = 5;
input AtrFactor = 0.7;

def ATRcci = Average(TrueRange(h, c, l), lengthATR) * AtrFactor;
def price = c + l + h;
def linDev = LinDev(price, lengthCCI);
def CCI = if linDev == 0
          then 0
          else (price - Average(price, lengthCCI)) / linDev / 0.015;
def MT1 = if CCI > 0
          then Max(MT1[1], pricedata - ATRcci)
          else Min(MT1[1], pricedata + ATRcci);
plot data = MT1;
data.AssignValueColor(if c < MT1 then Color.RED else Color.GREEN);

# Agg Period 2


input agg2 = AggregationPeriod.DAY;
def c2 = close(period = agg2);
def h2 = high(period = agg2);
def l2 = low(period = agg2);
def pricedata2 = hl2(period = agg2);

DefineGlobalColor("TrendUp", CreateColor(0, 254, 30));
DefineGlobalColor("TrendDown", CreateColor(255, 3, 2));


input lengthCCI2 = 50;
input lengthATR2 = 5;
input AtrFactor2 = 0.7;

def ATRcci2 = Average(TrueRange(h2, c2, l2), lengthATR2) * AtrFactor2;
def price2 = c2 + l2 + h2;
def linDev2 = LinDev(price2, lengthCCI2);
def CCI2 = if linDev2 == 0
          then 0
          else (price2 - Average(price2, lengthCCI2)) / linDev2 / 0.015;
def MT2 = if CCI2 > 0
          then Max(MT2[1], pricedata2 - ATRcci2)
          else Min(MT2[1], pricedata2 + ATRcci2);
plot data2 = MT2;
data2.AssignValueColor(if c2 < MT2 then Color.RED else Color.GREEN);
DefineGlobalColor("TrendUp", CreateColor(0, 254, 30));
DefineGlobalColor("TrendDown", CreateColor(255, 3, 2));

# Agg Period 3


input agg3 = AggregationPeriod.DAY;
def c3 = close(period = agg3);
def h3 = high(period = agg3);
def l3 = low(period = agg3);
def pricedata3 = hl2(period = agg3);

DefineGlobalColor("TrendUp", CreateColor(0, 254, 30));
DefineGlobalColor("TrendDown", CreateColor(255, 3, 2));


input lengthCCI3 = 50;
input lengthATR3 = 5;
input AtrFactor3 = 0.7;

def ATRcci3 = Average(TrueRange(h3, c3, l3), lengthATR3) * AtrFactor3;
def price3 = c3 + l3 + h3;
def linDev3 = LinDev(price3, lengthCCI3);
def CCI3 = if linDev3 == 0
          then 0
          else (price3 - Average(price3, lengthCCI3)) / linDev3 / 0.015;
def MT3 = if CCI3 > 0
          then Max(MT3[1], pricedata3 - ATRcci3)
          else Min(MT3[1], pricedata3 + ATRcci3);
plot data3 = MT3;
data3.AssignValueColor(if c3 < MT3 then Color.RED else Color.GREEN);
DefineGlobalColor("TrendUp", CreateColor(0, 254, 30));
DefineGlobalColor("TrendDown", CreateColor(255, 3, 2));

nTHFOYw.png
 

Attachments

  • nTHFOYw.png
    nTHFOYw.png
    113.1 KB · Views: 174
Last edited:
On SPY it is plotting a green line at 0, which makes the chart very compressed. Tried with and without pre-market data.

Wouldn't plot with other aggregation values and chart time frames.

S2.png
 
@thinky How did you do that ? Sorry without more information I cannot help. Only suggestion is make sure your chart time frame is equal or less than lowest aggregation in the study.
 
When I scrolled the chart to the right, away from the 0 line at the beginning, it plotted correctly.

Somehow it is plotting '0' and messing with the price axis auto setting. In this example used the 5D 5m time frame and the indicator default aggregation values.

S3.png
 
@thinky 1. some studies have what's called a pre-fetch. 2. It's possible that one of your other studies doesn't play nice with this one. Take notes and pull studies out one at a time. 3. Also, match Horserider's chart agg: 10D5Min.
I noticed that the example at top only has the current study applied. 🤷‍♂️
 
The indicator works with 10D 5m with Auto/Fit checked, but not with 5D 5m with Auto/Fit checked. So must uncheck Auto/Fit to use 5D 5m.

Is it because the longer aggregation data (agg2/3: Day) feeding values that make the plot behave this way (0 value, extreme ranges).

It is a weird behavior, the difference is 10D vs 5D (both screenshots with Auto/Fit checked):

S5.png


S6.png
 
Last edited:
@thinky we've been down this road before, haven't we?
Please go to Tutorials and Click on Super Secret Phone Number.
Someone at that number will be able to tell you why.
It's the ToS Advanced Option Dept. and they have the knowledge to work on all the peculiar problems.

Please let the group here know what you find out. Markos
 
@horserider is this the most current code for (and do I need to alter anything
#Trend Magic Indicator
#Revised with Auto Aggregation and Global Colors
#Originally posted by horserider

def agg = getAggregationPeriod();
def c = close(period = agg);
def h = high(period = agg);
def l = low(period = agg);
def pricedata = hl2(period = agg);
DefineGlobalColor("TrendUp", CreateColor(0, 254, 30));
DefineGlobalColor("TrendDown", CreateColor(255, 3, 2));
input lengthCCI = 50;
input lengthATR = 5;
input AtrFactor = 0.7;
def ATRcci = Average(TrueRange(h, c, l), lengthATR) * AtrFactor;
def price = c + l + h;
def linDev = LinDev(price, lengthCCI);
def CCI = if linDev == 0
then 0
else (price - Average(price, lengthCCI)) / linDev / 0.015;
def MT1 = if CCI > 0
then Max(MT1[1], pricedata - ATRcci)
else Min(MT1[1], pricedata + ATRcci);
plot data = MT1;
data.AssignValueColor(if c < MT1 then GlobalColor("TrendDown") else GlobalColor("TrendUp"));
 
@Shinthus May look similiar but based on different indicators. And different lengths is not the same as different aggregations. So may look similar but big differences.
 
@Billions That is the original study with a change to make the study match the chart time frame. I newest code is the multitime frame in this thread. Depends what you want. I recommend the multitime frame but it takes a bit of effort to first set the time frames like you want. But is pretty easy just a few clicks. The single time frame with aggregation user set in the thread where the Trend Magic was first posted is also better in my opinion. Being able to set the aggregation has an advantage.
 
@Billions That is the original study with a change to make the study match the chart time frame. I newest code is the multitime frame in this thread. Depends what you want. I recommend the multitime frame but it takes a bit of effort to first set the time frames like you want. But is pretty easy just a few clicks. The single time frame with aggregation user set in the thread where the Trend Magic was first posted is also better in my opinion. Being able to set the aggregation has an advantage.
I’ll hve to check it out thanks
 
Can someone help need to code this for mobile I don't know if it can be done:
def agg = getAggregationPeriod();
def c = close(period = agg);
def h = high(period = agg);
def l = low(period = agg);
def pricedata = hl2(period = agg);
DefineGlobalColor("TrendUp", CreateColor(0, 254, 30));
DefineGlobalColor("TrendDown", CreateColor(255, 3, 2));
input lengthCCI = 50;
input lengthATR = 5;
input AtrFactor = 0.7;
def ATRcci = Average(TrueRange(h, c, l), lengthATR) * AtrFactor;
def price = c + l + h;
def linDev = LinDev(price, lengthCCI);
def CCI = if linDev == 0
then 0
else (price - Average(price, lengthCCI)) / linDev / 0.015;
def MT1 = if CCI > 0
then Max(MT1[1], pricedata - ATRcci)
else Min(MT1[1], pricedata + ATRcci);
plot data = MT1;
data.AssignValueColor(if c < MT1 then GlobalColor("TrendDown") else GlobalColor("TrendUp"));
 

Join useThinkScript to post your question to a community of 21,000+ developers and traders.

Similar threads

Not the exact question you're looking for?

Start a new thread and receive assistance from our community.

87k+ Posts
305 Online
Create Post

Similar threads

Similar threads

The Market Trading Game Changer

Join 2,500+ subscribers inside the useThinkScript VIP Membership Club
  • Exclusive indicators
  • Proven strategies & setups
  • Private Discord community
  • ‘Buy The Dip’ signal alerts
  • Exclusive members-only content
  • Add-ons and resources
  • 1 full year of unlimited support

Frequently Asked Questions

What is useThinkScript?

useThinkScript is the #1 community of stock market investors using indicators and other tools to power their trading strategies. Traders of all skill levels use our forums to learn about scripting and indicators, help each other, and discover new ways to gain an edge in the markets.

How do I get started?

We get it. Our forum can be intimidating, if not overwhelming. With thousands of topics, tens of thousands of posts, our community has created an incredibly deep knowledge base for stock traders. No one can ever exhaust every resource provided on our site.

If you are new, or just looking for guidance, here are some helpful links to get you started.

What are the benefits of VIP Membership?
VIP members get exclusive access to these proven and tested premium indicators: Buy the Dip, Advanced Market Moves 2.0, Take Profit, and Volatility Trading Range. In addition, VIP members get access to over 50 VIP-only custom indicators, add-ons, and strategies, private VIP-only forums, private Discord channel to discuss trades and strategies in real-time, customer support, trade alerts, and much more. Learn all about VIP membership here.
How can I access the premium indicators?
To access the premium indicators, which are plug and play ready, sign up for VIP membership here.
Back
Top