Three Bar Reversal Pattern and Indicator for ThinkorSwim

BenTen

Administrative
Staff member
Staff
VIP
Lifetime
The three bar reversal pattern is a significant signal in technical analysis, often used by traders to identify potential trend reversals. It typically consists of three consecutive bars on a price chart, indicating a shift from a prevailing trend to a new direction. This pattern is characterized by the first bar representing the current trend, followed by a second bar indicating a potential reversal, and finally confirmed by the third bar, which typically closes beyond the high or low of the first bar, signaling a reversal. Traders often use this pattern to make informed decisions about entering or exiting positions in the market.
xgCSoNa.png

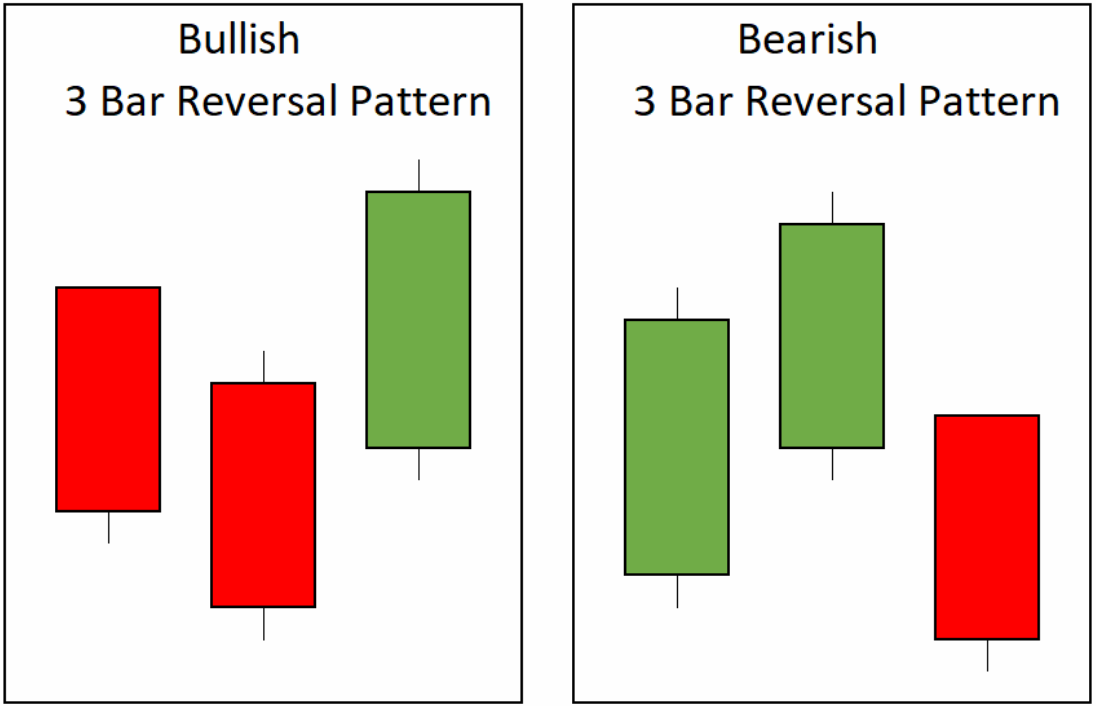
The setup looks for a few consecutive red candlesticks and the final bar being a green candle closing higher than previous bars.

Here is an example:

ffdQorx.png


Below is the code to identify bullish trigger bar in the Three Bar Reversal pattern. It also comes with an alert system.

thinkScript Code

Rich (BB code):
# Three-Bar Reversal Indicator
# Found in the thinkScript Archive
# Alert added by WalkingBallista
# https://usethinkscript.com/d/187-three-bar-reversal-pattern-and-indicator-for-thinkorswim

def TBRup = close > open[1] and close[1] < close[2]  and close[2] < close[3] and close[3] < close[4];
plot bullish = if TBRup then high else Double.NaN;
bullish.SetPaintingStrategy(PaintingStrategy.BOOLEAN_ARROW_UP);
alert(bullish,"TBR Up", alert.Bar,sound.ding);

Shareable Link

https://tos.mx/pLfTyM

If you would like to look for bearish trigger bar in this pattern, you can insert the following code into that indicator.

Rich (BB code):
def TBRdown = close < open[1] and close[1] > close[2] and close[2] > close[3] and close[3] > close[4];
plot bearish = if TBRdown then low else Double.NaN;
bearish.SetPaintingStrategy(PaintingStrategy.BOOLEAN_ARROW_DOWN);
alert(bearish,"TBR Down", alert.Bar, sound.ding);

The script was posted on the thinkScript Lounge Archive. It did not mention who created the indicator.
 

Attachments

  • ffdQorx.png
    ffdQorx.png
    325 KB · Views: 252
Last edited by a moderator:

Join useThinkScript to post your question to a community of 21,000+ developers and traders.

@BenTen I would like to add a label to top left corner side of the chart, how should i write the AddLabel command for above charts to show if currently in TBRUP or TBRDown status.Thank You
 
This indicator indicates the place of three bar reversal with arrows on the chart📈. The formation is quite specific. Not many people know about it.

⚙Let's place the indicator according to the "three bar reversal" pattern. We'll choose a 5-minute timeframe for that. Import indicator by using <Edit Studies> menu. It will appear on the list. You need to enter Studies – User Defined. Click on the necessary indicator and add - "Add Study".
________________
Code:
#thinkscript indicator: Three_Bar_Reversal.
#Shows the pattern "Three Bar Reversal"
#by thetrader.top

def bSignalDown = open[2]<close[2] and low[1]>low[2] and low[1]<high[2] and high[1]>high[2] and high<high[1] and close[1]<low[1];
def bSignalUp = open[2]>close[2] and low[1]<low[2] and low[2]<high[1] and low[1]<low[2] and low>low[1] and low<high[1] and close>high[1];
plot down = if bSignalDown then high else double.NaN;
plot up = if bSignalUp then high else double.NaN;
up.SetPaintingStrategy(paintingStrategy.BOOLEAN_ARROW_up);
down.SetPaintingStrategy(paintingStrategy.BOOLEAN_ARROW_down);
up.setDefaultColor(color.LIGHT_green);
down.setDefaultColor(color.LIGHT_red);

w7etRp5.png
 
Last edited by a moderator:
Hi Ben, The three bars reversal indicator is excellent! but can you change the last green candle must higher then the previous candle's wick not the close. Thank you so much!
 
BenTen is big pimpin! Appreciate all the hard work you put into this. I will be referencing this site and yourself on anything I use or modify. Cheers!
 
Yes BenTen the last green candle should close one penny higher than the high of the previous candle. I have been using the TBR conjunction with other indicator from this Forums, they work so well and less emotion to trade. Thank you so much!
 
@LynnChen Try this:

Code:
# Generation time: 2020-08-05T22:36:03.729Z

def IsUp = close > open;
def IsDown = close < open;
def IsDoji = IsDoji();
def avgRange = 0.05 * Average(high - low, 20);
plot PatternPlot =
    IsDown[3] and
    IsDown[2] and
    IsDown[1] and
    IsUp[0] and
    high[1] < close[0];

PatternPlot.SetPaintingStrategy(PaintingStrategy.BOOLEAN_ARROW_UP);
PatternPlot.SetDefaultColor(GetColor(0));
 
@BenTen Love the idea of this indicator. But testing reveals it doesn't work on every legit reversal (like when there's a gap between the first and the second bar, and when the second bar is bigger than the first(get it right sometimes)).

The code above, which ensures that the third bar in the reversal closes higher than the high of the previous red bar, seems to not make use of the IsDoji and avgRange variables. What do they do?

Also, how would you write the bearish version of this? I tried the following but I don't think it works correctly:

Code:
plot bearish =  IsUp[3] and IsUp[2] and IsUp[1] and

IsDown[0] and low[1] > close[0];
 
Last edited:
@DudeDastic You can actually use the built-in ThinkorSwim candlestick pattern builder to create your own version.

Click on Patterns > Select patterns > Candlestick >Create...

jdKSXMp.png
 
Can someone create a morning star indicator? Similar to the blastoff indicator but it highlights only morning star dojis. This is one of the strongest candlestick patterns out there, think it could be a huge use for folks. Thanks for everything in this community!
 

Similar threads

Not the exact question you're looking for?

Start a new thread and receive assistance from our community.

87k+ Posts
519 Online
Create Post

Similar threads

Similar threads

The Market Trading Game Changer

Join 2,500+ subscribers inside the useThinkScript VIP Membership Club
  • Exclusive indicators
  • Proven strategies & setups
  • Private Discord community
  • ‘Buy The Dip’ signal alerts
  • Exclusive members-only content
  • Add-ons and resources
  • 1 full year of unlimited support

Frequently Asked Questions

What is useThinkScript?

useThinkScript is the #1 community of stock market investors using indicators and other tools to power their trading strategies. Traders of all skill levels use our forums to learn about scripting and indicators, help each other, and discover new ways to gain an edge in the markets.

How do I get started?

We get it. Our forum can be intimidating, if not overwhelming. With thousands of topics, tens of thousands of posts, our community has created an incredibly deep knowledge base for stock traders. No one can ever exhaust every resource provided on our site.

If you are new, or just looking for guidance, here are some helpful links to get you started.

What are the benefits of VIP Membership?
VIP members get exclusive access to these proven and tested premium indicators: Buy the Dip, Advanced Market Moves 2.0, Take Profit, and Volatility Trading Range. In addition, VIP members get access to over 50 VIP-only custom indicators, add-ons, and strategies, private VIP-only forums, private Discord channel to discuss trades and strategies in real-time, customer support, trade alerts, and much more. Learn all about VIP membership here.
How can I access the premium indicators?
To access the premium indicators, which are plug and play ready, sign up for VIP membership here.
Back
Top