I have complied various indicators, found within this forum, which provides me some very reliable signals. I can't give proper credit to the original authors for each of the various indicators that I utilized because I don't remember them. However, I do verify that all code was derived from here are is my code so it should be okay to share.
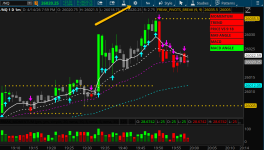
Basically just wait for a signal and trade it. Pay attention to the strength of the current candle and play accordinally. The arrows and the bar color are derrived from the same information and were added as visual enhancments.

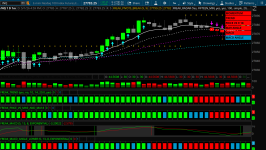
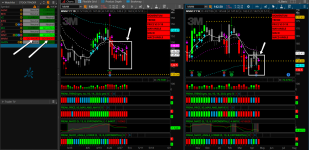
Two indicators for top and one bottom
TOP indicator #1
TOP indicator #2
BOTTOM indicator
Basically just wait for a signal and trade it. Pay attention to the strength of the current candle and play accordinally. The arrows and the bar color are derrived from the same information and were added as visual enhancments.
Two indicators for top and one bottom
TOP indicator #1
Code:
input Length_Forward = 9;
input Length_Backward = 9;

#def _BN = BarNumber(); # current barnumber
def na = Double.NaN; # non-numeric values
def _H = high; # high price
def _L = low; # low price
def _C = close; # close price
def _O = open; # open price
#def _LL = Lowestall(_L); # lowest _L price
#def _HH = highestall(_H); # highest _H price

script FindPivots {
input dat = high; # default data or study being evaluated
input HL = 0; # default high or low pivot designation, -1 low, +1 high
input PF = 1; # default pivot forward period
input PB = 5; # default pivot backward period

##############
def _nan; # used for non-number returns
def _BN; # the current barnumber
def _VStop; # confirms that the lookforward period continues the pivot trend
def _V; # the Value at the actual pivot point
def _VBar; # the bar number at the pivot point
def _PV; # the previous pivot Value
def _PVBar; # the previous pivot bar number
def _VDiff; # the difference in values between last two pivot points
def _VDist; # the diffence in barnumbers between last two pivot points
def _VSlope; # the Slope calculated using value and distance changes
def _VPivot; # used for the pivot point connector line only
##############

_BN = BarNumber();
_nan = Double.NaN;
_VStop =
fold a = 1 to PF + 1
with b = 1 while b
do if HL > 0 then
dat > GetValue(dat, -a) else
dat < GetValue(dat, -a) ;
if (HL > 0) {
_V = if _BN > PB and dat == Highest(dat, PB) and _VStop
then dat else _nan;
} else {
_V = if _BN > PB and dat == Lowest(dat, PB) and _VStop
then dat else _nan;
}
;
_VBar = if !IsNaN(_V) then _BN else _VBar[1];
_PV = if !IsNaN(_V) then GetValue(dat, _BN - _VBar[1]) else _PV[1];
_PVBar = if _VBar != _VBar[1]
then _PVBar[1] else _VBar;
_VDiff = AbsValue(_V) - AbsValue(_PV);
_VDist = _BN - _PVBar;
_VSlope = if _V > _PV then 1 else
if _V < _PV then -1 else 0;
if (HL > 0) {
_VPivot = _BN >= HighestAll(_PVBar);
} else {
_VPivot = _BN >= LowestAll(_PVBar);
}
;
plot result = if !IsNaN(_V) and _VStop then _V else _nan; #return the final _dat value at the most recent pivot point (same as V)
}

def ph = findpivots(_H, 1, length_forward, length_backward)."result";
def pl = findpivots(_L, -1, length_forward, length_backward)."result";

def ph_1 = if !isnan(ph) then ph else ph_1[1];
def pl_1 = if !isnan(pl) then pl else pl_1[1];

def hh = !isnan(ph) and ph > ph_1[1];
def ll = !isnan(pl) and pl < pl_1[1];

#--------------------------------------------------------------
def LastTF = CompoundValue(1, if isNaN(ph) then LastTF[1] else ph, ph);
def LastBF = CompoundValue(1, if isNan(pl) then LastBF[1] else pl, pl);
#--------------------------------------------------------------

plot HLine = LastTF ;
HLine.SetPaintingStrategy(PaintingStrategy.POINTS);
HLine.SetLineWeight(2);
HLine.SetDefaultColor(CreateColor(231,190,0));

plot LLine = LastBF ;
LLine.SetPaintingStrategy(PaintingStrategy.POINTS);
LLine.SetDefaultColor(CreateColor(231,190,0));
LLine.SetLineWeight(2);
TOP indicator #2
Code:
plot ma9 = ExpAverage(close, 9);
ma9.SetDefaultColor(Color.white);
ma9.SetStyle(Curve.FIRM);
ma9.SetLineWeight(2);

plot ma18 = ExpAverage(close, 18);
ma18.SetDefaultColor(Color.WHITE);
ma18.SetStyle(Curve.SHORT_DASH);
ma18.SetLineWeight(2);

plot ma34 = ExpAverage(close, 34);
ma34.SetDefaultColor(Color.MAGENTA);
ma34.SetStyle(Curve.SHORT_DASH);
ma34.SetLineWeight(2);

plot ma89 = ExpAverage(close, 89);
ma89.SetDefaultColor(Color.CYAN);
ma89.SetStyle(Curve.SHORT_DASH);
ma89.SetLineWeight(2);

#MOMENTUM .........................................................................

input UseChartTimeframe = {default "Yes", "No"};
input CustomAggregation = AggregationPeriod.FIFTEEN_MIN;

input Signal_Line = yes;
input rofLine = yes;
input bandScale = {default "100", "200", "400"}; # "Band Scale"
input LookbackCalcType = "simple";
input lookback = 20;
input RofType = "wma";
input RofLength = 10;
input RofSmooth = 3;
input SignalType = "wma";
input signalLength = 5;
input BiasType = "wma";
input BiasLength = 30;

def na = Double.NaN;
def pos = Double.POSITIVE_INFINITY;
def neg = Double.NEGATIVE_INFINITY;
def last = IsNaN(close);


def scale;
switch (bandScale) {
case "100" :
scale = 100;
case "200" :
scale = 200;
case "400" :
scale = 400;
}
def c;
def h;
def l;
def o;
def vol;
switch (UseChartTimeframe) {
case "Yes" :
c = close;
h = high;
l = low;
o = open;
vol = volume;
case "No" :
c = close(Period = CustomAggregation);
h = high(Period = CustomAggregation);
l = low(Period = CustomAggregation);
o = open(Period = CustomAggregation);
vol = volume(Period = CustomAggregation);
}

#// --- Functions
#GetAverage(_data, _len, MAOption) =>
script GetAverage {
input _data = close;
input _len = 10;
input MAOption = "SMA";
def mav = ((Average(_data, _len)[1] * (_len - 1)) + _data) / _len;
def GetAverage = if MAOption == "SMA" then Average(_data, _len) else
if MAOption == "EMA" then ExpAverage(_data, _len) else
if MAOption == "MAV" then mav else
if MAOption == "HMA" then HullMovingAvg(_data, _len) else
if MAOption == "RMA" then WildersAverage(_data, _len) else
if MAOption == "WMA" then WMA(_data, _len) else Average(_data, _len);
plot out = GetAverage;
}
#Normalize(_Value, _Avg) =>
script Normalize {
input _Value = close;
input _Avg = 10;
def _X = _Value / _Avg;
def _Nor =
if _X > 1.50 then 1.00 else
if _X > 1.20 then 0.90 else
if _X > 1.00 then 0.80 else
if _X > 0.80 then 0.70 else
if _X > 0.60 then 0.60 else
if _X > 0.40 then 0.50 else
if _X > 0.20 then 0.25 else 0.1;
plot norm = _Nor;
}
#// Calculations
def v = if IsNaN(vol) then 1 else vol;
def NoVol_Flag = if IsNaN(v) then yes else no;# // this is a flag to use later
def volSMA = Average(v, lookback);
def volROFF = GetAverage(v, lookback, RofType);
def Vola = volSMA;

def Vola_n_pre = Normalize(v, Vola) * 100;

#//Now trap the case of no volume data - ensure final calculation not impacted
def Vola_n = if NoVol_Flag then 100 else Vola_n_pre;

def BarSpread = (c - o);
def hl = (h - l);
def BarRange = if hl == 0 then BarRange[1] else hl;
def hhll = Highest(h, 2) - Lowest(l, 2);
def R2 = if hhll == 0 then R2[1] else hhll;
def SrcShift = c - c[1];
#//TR = ta.tr(true)

def sign_shift = Sign(SrcShift);
def sign_spread = Sign(BarSpread);
#// in-bar assessments
def dif = (c - l);#if (c - l)==0 then dif[1] else (c - l);
def barclosing = 2 * dif / BarRange * 100 - 100;
def s2r = BarSpread / BarRange * 100;

def BarSpread_abs = AbsValue(BarSpread);
def barSMA = Average(BarSpread_abs, lookback);
def barROFF = GetAverage(BarSpread_abs, lookback, RofType);
def BarSpread_avg = barSMA;

def BarSpread_ratio_n = Normalize(BarSpread_abs, BarSpread_avg) * 100 * sign_spread ;

#// 2-bar assessments
def cl = c - Lowest(l, 2);
def barclosing_2 = 2 * cl / R2 * 100 - 100;
def Shift2Bar_toR2 = SrcShift / R2 * 100;
#// 6. Calculate 2-bar Relative Shift
def SrcShift_abs = AbsValue(SrcShift);
def srcSMA = Average(SrcShift_abs, lookback);
def srcRROF = GetAverage(SrcShift_abs, lookback, RofType);
def srcshift_avg = srcSMA;

def srcshift_ratio_n = Normalize(SrcShift_abs, srcshift_avg) * 100 * sign_shift;
#/ Relative Price Strength combining all strength elements
def Pricea_n = (barclosing + s2r + BarSpread_ratio_n + barclosing_2 + Shift2Bar_toR2 + srcshift_ratio_n) / 6;
# "Price Normalized"
#//Let's take Bar Flow as the combined price strength * the volume:avg ratio
def bar_flow = Pricea_n * Vola_n / 100;
#/ Relative Price Strength combining all strength elements
def bulls = Max(bar_flow, 0);
def bears = -1 * Min(bar_flow, 0);

def bulls_avg = GetAverage(bulls, RofLength, RofType);
def bears_avg = GetAverage(bears, RofLength, RofType);
def dx = bulls_avg / bears_avg;
def RROF = 2 * (100 - 100 / (1 + dx)) - 100;
def RROF_s = WMA(RROF, RofSmooth);

def Signal = GetAverage(RROF_s, signalLength, SignalType);
#// Calculate Bias / sentiment on longer length
def bulls_bia = GetAverage(bulls, BiasLength, BiasType);
def bears_bia = GetAverage(bears, BiasLength, BiasType);
def dx_b = bulls_bia / bears_bia;
def RROF_b = 2 * (100 - 100 / (1 + dx_b)) - 100;
def RROF_bs = WMA(RROF_b, RofSmooth);
#// Colors & plots
def up = RROF_s >= 0;
def s_up = RROF_bs >= 0;


#// =============================================================================
#// Plot Price Strength & Relative Volume as stacked "equalizer bands"

def nPrice = Max(Min(Pricea_n, 100), -100);
def nVol = Max(Min(Vola_n, 100), -100);
def bar = bar_flow;
def c_vol = bar > 0;
def vc_lo = 0;
def vc_hi = nVol * scale / 100 / 2;
def pc_lo = vc_hi;
def pc_hi = vc_hi + AbsValue(nPrice) * scale / 100 / 2;


#// ===========================================================================================================
#// v2.0 Adding Markers for Key Patterns
#// ===========================================================================================================
#// we can re-utilize the Normailize() function here too - but it's cleaner to have a separate ratio calc
def nPrice_abs = AbsValue(nPrice);
#//EV_Ratio = 100 * Normalize(nPrice_abs, nVol)
def EV_Ratio = 100 * nPrice_abs / nVol;

#// initial mapping of return ratios (to be revised)
#// -------------------------------------------------------
#// Case (1): Price > Vol => ratio > 120 = Ease of Move (EoM)
#// Case (2): Price close to Vol => ratio between 80 - 120 = Reasonable Balance
#// Case (3): Price less than Vol but reasonable => ratio between 80 - 50 = Drift / "nothing much to see here" bar
#// Case (4): Price a lot less than Vol => 50 or less = Compression / Squat
#// we're most interested in cases 1 & 4

#//plot (EV_Ratio) // for validation only
def is_positive = nPrice > 0;
def is_Compression = EV_Ratio <= 50;
def is_EoM = EV_Ratio >= 120;


#-- Bar Color
def ExtUp = s_up and c_vol;
def ExtDn = !s_up and !c_vol;

#-- 3MA Signal
def LONG = if ExtUp or !s_up and !ExtDn then 1 else 0;
def SHORT = if ExtDn or s_up and !ExtUp then 1 else 0;

AddLabel(yes, "MOMENTUM " , if LONG then Color.GREEN else Color.RED, location = Location.TOP_RIGHT, size = FontSize.SMALL, "row ownership" = yes);


#TREND............................................................................................

declare real_size;

input showverticals = yes;
input alert = No;
input ghlaPeriod = 10;
input stPeriod = 14;
input stShiftTicks = 20.0;
input useFilter = yes;

def minTick = TickSize();
def shift = stShiftTicks * minTick;

# -----------------------------
# GHLA Logic
# -----------------------------
def ghlaAvgH = Average(high, ghlaPeriod);
def ghlaAvgL = Average(low, ghlaPeriod);

def sw = if close > ghlaAvgH then 1
else if close < ghlaAvgL then -1
else 0;

def ghlaDir = CompoundValue(1, if sw != 0 then sw else ghlaDir[1], 0);
def ghlaLevel = if ghlaDir < 0 then ghlaAvgH else ghlaAvgL;

# -----------------------------
# Custom CCI using Typical Price
# -----------------------------
def tp = (high + low + close) / 3;
def tpSMA = Average(tp, stPeriod);
def meanDev = Average(AbsValue(tp - tpSMA), stPeriod);
def cciValue = if meanDev == 0 then 0 else (tp - tpSMA) / (0.015 * meanDev);

# -----------------------------
# SuperTrend State Machine
# -----------------------------

# stFlag: 1=long, -1=short
rec stFlag = if IsNaN(stFlag[1]) then if cciValue >= 0 then 1 else -1
else if cciValue > 0 and stFlag[1] <= 0 then 1
else if cciValue < 0 and stFlag[1] >= 0 then -1
else stFlag[1];

rec st = if IsNaN(st[1]) then if cciValue >= 0 then low - shift else high + shift
else
if cciValue > 0 and stFlag[1] <= 0 then low - shift
else if cciValue < 0 and stFlag[1] >= 0 then high + shift
else
if stFlag > 0 and (low - shift) > st[1] then low - shift
else if stFlag < 0 and (high + shift) < st[1] then high + shift
else
if useFilter and stFlag > 0 and st[1] < st[1] and (close < open or high < high[1]) then st[1]
else if useFilter and stFlag < 0 and st[1] > st[1] and (close > open or low > low[1]) then st[1]
else st[1];

# -----------------------------
# signals
# -----------------------------
def notNaST = !IsNaN(st);
def upSignal = notNaST and close > st and close > ghlaLevel;
def downSignal = notNaST and close < st and close < ghlaLevel;
def neutralSignal = notNaST and !upSignal and !downSignal;


AddLabel(yes, "TREND " , if upSignal then Color.GREEN else if downSignal then Color.RED else CreateColor(0, 153, 204) , location = Location.TOP_RIGHT, size = FontSize.SMALL, "row ownership" = yes);


# PRICE VS MA9 AND MA18 ............................................................................


def BEAR_5algo2 = if close < ma18 and close < ma9 then 1 else 0;
def BULL_5algo2 = if close > ma18 and close > ma9 then 1 else 0;

#SIGNAL ------------------------------------------------------------------------------

#plot BEAR_CORRELATION = if !BEAR_5algo2 and !BULL_5algo2 then 1 else 0;

AddLabel(yes, "PRICE VS 9 18 " , if BULL_5algo2 then Color.GREEN else if BEAR_5algo2 then Color.RED else CreateColor(0, 153, 204) , location = Location.TOP_RIGHT, size = FontSize.SMALL, "row ownership" = yes);

#MA DIRECTIONAL..................................................................................

def BEAR_DIR = if ma9 < ma9[1] then 1 else 0;
def BULL_DIR = if ma9 > ma9[1] then 1 else 0;

AddLabel(yes, "MA9 ANGLE " , if BULL_DIR then Color.GREEN else Color.RED , location = Location.TOP_RIGHT, size = FontSize.SMALL, "row ownership" = yes);


# MACD .....................................................................................

input fastLength = 5;
input slowLength = 13;
input MACDLength = 8;
input averageType = AverageType.EXPONENTIAL;

def Value = MovingAverage(averageType, close, fastLength) - MovingAverage(averageType, close, slowLength);

def Avg = MovingAverage(averageType, Value, MACDLength);

#-- Color Change Signal
def BULL_color = if Value > Avg then 1 else 0;
def BEAR_color = if Value < Avg then 1 else 0;

#AddVerticalLine(BULL_color , "", Color.green, Curve.FIRM);
#AddVerticalLine(BEAR_color , "", Color.red, Curve.FIRM);

#addCloud(if A_PLUS_BULL then Double.NEGATIVE_INFINITY else Double.POSITIVE_INFINITY, if A_PLUS_BULL then Double.POSITIVE_INFINITY else Double.NEGATIVE_INFINITY, Color.black, Color.gray);

AddLabel(yes, "MACD " , if BULL_color then Color.GREEN else Color.RED , location = Location.TOP_RIGHT, size = FontSize.SMALL, "row ownership" = yes);

def BULL_ANGLE = if Value > Value[1] then 1 else 0;
def BEAR_ANGLE = if Value < Value[1] then 1 else 0;

AddLabel(yes, "MACD ANGLE " , if BULL_ANGLE then Color.GREEN else Color.RED , location = Location.TOP_RIGHT, size = FontSize.SMALL, "row ownership" = yes);


# RADAR ..................................................................................
def A_PLUS_BULL = if LONG and upSignal and BULL_5algo2 and BULL_DIR and BULL_color then 1 else 0;
def A_PLUS_BEAR = if SHORT and downSignal and BEAR_5algo2 and BEAR_DIR and BEAR_color then 1 else 0;

#AssignPriceColor( if A_PLUS_BULL then Color.green else if A_PLUS_BEAR then color.red else Color.blue);
def A_PLUS_BULL1 = if upSignal and BULL_5algo2 and BULL_DIR and BULL_color and BULL_ANGLE then 1 else 0;
def A_PLUS_BEAR1 = if downSignal and BEAR_5algo2 and BEAR_DIR and BEAR_color and BEAR_ANGLE then 1 else 0;

plot BULL_color1 = if A_PLUS_BULL1 then close else 0;
BULL_color1.AssignValueColor(Color.CYAN);
BULL_color1.SetPaintingStrategy(PaintingStrategy.BOOLEAN_ARROW_UP);
BULL_color1.SetLineWeight(5);
Alert(BULL_color1 , "LONG", Alert.BAR, Sound.Chimes);

plot BEAR_color1 = if A_PLUS_BEAR1 then close else 0;
BEAR_color1.AssignValueColor(Color.MAGENTA);
BEAR_color1.SetPaintingStrategy(PaintingStrategy.BOOLEAN_ARROW_DOWN);
BEAR_color1.SetLineWeight(5);
Alert(BEAR_color1 , "SHORT", Alert.BAR, Sound.Chimes);

AssignPriceColor( if BULL_color1 then Color.GREEN else if BEAR_color1 then Color.RED else Color.GRAY );
BOTTOM indicator
Code:
declare lower;

input Signal_Line = yes;
input rofLine = yes;
input LookbackCalcType = "simple";
input lookback = 20;
input RofType = "wma";
input RofLength = 10;
input RofSmooth = 3;
input SignalType = "wma";
input signalLength = 5;
input BiasType = "wma";
input BiasLength = 30;

def na = Double.NaN;
def pos = Double.POSITIVE_INFINITY;
def neg = Double.NEGATIVE_INFINITY;
def last = isNaN(close);
def scale = 100;
def c = close; def h = high; def l = low; def o = open; def vol = volume;

#---- Color
DefineGlobalColor("c_vol_grn" , color.dark_green);
DefineGlobalColor("b_vol_grn" , color.dark_green);
DefineGlobalColor("c_vol_red" , color.dark_red);
DefineGlobalColor("b_vol_red" , color.red);
DefineGlobalColor("c_pri_grn" , color.green);
DefineGlobalColor("b_pri_grn" , color.green);
DefineGlobalColor("c_pri_red" , color.red);
DefineGlobalColor("b_pri_red" , color.red);


script GetAverage {
input _data = close;
input _len = 10;
input MAOption = "SMA";
def mav = ((Average(_data, _len)[1]*(_len-1)) + _data) / _len;
def GetAverage = if MAOption == "SMA" then Average(_data, _len) else
if MAOption == "EMA" then ExpAverage(_data, _len) else
if MAOption == "MAV" then mav else
if MAOption == "HMA" then HullMovingAvg(_data, _len) else
if MAOption == "RMA" then WildersAverage(_data, _len) else
if MAOption == "WMA" then WMA(_data, _len) else Average(_data, _len);
plot out = GetAverage;
}

script Normalize {
input _Value = close;
input _Avg = 10;
def _X = _Value / _Avg;
def _Nor =
if _X > 1.50 then 1.00 else
if _X > 1.20 then 0.90 else
if _X > 1.00 then 0.80 else
if _X > 0.80 then 0.70 else
if _X > 0.60 then 0.60 else
if _X > 0.40 then 0.50 else
if _X > 0.20 then 0.25 else 0.1;
plot norm = _Nor;
}

def v = if isNaN(vol) then 1 else vol;
def NoVol_Flag = if IsNaN(v) then yes else no;
def volSMA = Average(v,lookback);
def volROFF = GetAverage(v, lookback, RofType);
def Vola = volSMA;
def Vola_n_pre = Normalize(v, Vola) * 100;
def Vola_n = if NoVol_Flag then 100 else Vola_n_pre;
def BarSpread = (c - o);
def hl = (h - l);
def BarRange = if hl==0 then BarRange[1] else hl;
def hhll = Highest(h, 2) - Lowest(l, 2);
def R2 = if hhll==0 then R2[1] else hhll;
def SrcShift = c - c[1];
def sign_shift = Sign(SrcShift);
def sign_spread = Sign(BarSpread);
def dif = (c - l);
def barclosing = 2 * dif / BarRange * 100 - 100;
def s2r = BarSpread / BarRange * 100;
def BarSpread_abs = AbsValue(BarSpread);
def barSMA = Average(BarSpread_abs,lookback);
def barROFF = GetAverage(BarSpread_abs, lookback, RofType);
def BarSpread_avg = barSMA;
def BarSpread_ratio_n = Normalize(BarSpread_abs, BarSpread_avg) * 100 * sign_spread ;
def cl = c - Lowest(l, 2);
def barclosing_2 = 2 * cl / R2 * 100 - 100;
def Shift2Bar_toR2 = SrcShift / R2 * 100;
def SrcShift_abs = AbsValue(SrcShift);
def srcSMA = Average(SrcShift_abs,lookback);
def srcRROF = GetAverage(SrcShift_abs, lookback, RofType);
def srcshift_avg = srcSMA;
def srcshift_ratio_n = Normalize(SrcShift_abs, srcshift_avg) * 100 * sign_shift;
def Pricea_n = (barclosing + s2r + BarSpread_ratio_n + barclosing_2 + Shift2Bar_toR2 + srcshift_ratio_n) / 6;
def bar_flow = Pricea_n * Vola_n / 100;
def bulls = Max(bar_flow, 0);
def bears = -1 * Min(bar_flow, 0);
def bulls_avg = GetAverage(bulls, RofLength, RofType);
def bears_avg = GetAverage(bears, RofLength, RofType);
def dx = bulls_avg / bears_avg;
def RROF = 2 * (100 - 100 / (1 + dx)) - 100;
def RROF_s = WMA(RROF, RofSmooth);
def Signal = GetAverage(RROF_s, signalLength, SignalType);
def bulls_bia = GetAverage(bulls, BiasLength, BiasType);
def bears_bia = GetAverage(bears, BiasLength, BiasType);
def dx_b = bulls_bia / bears_bia;
def RROF_b = 2 * (100 - 100 / (1 + dx_b)) - 100;
def RROF_bs = WMA(RROF_b, RofSmooth);
def up = RROF_s >= 0;
def s_up = RROF_bs >= 0;
def nPrice = Max(Min(Pricea_n, 100), -100);
def nVol = Max(Min(Vola_n, 100), -100);
def bar = bar_flow;
def c_vol = bar > 0;
def vc_lo = 0;
def vc_hi = nVol * scale / 100 / 2;
def pc_lo = vc_hi ; def pc_hi = vc_hi + AbsValue(nPrice) * scale / 100 / 2;

AddChart(high = if c_vol then pc_hi else na , low = pc_lo , open = pc_hi, close = if c_vol then pc_lo else na,
type = ChartType.CANDLE, growcolor = GlobalColor("c_pri_grn"));
AddChart(high = if c_vol then pc_hi else na , low = pc_lo , open = pc_lo, close = if c_vol then pc_hi else na,
type = ChartType.CANDLE, growcolor = GlobalColor("b_pri_grn"));

AddChart(high = if c_vol then na else pc_hi, low = pc_lo , open = pc_hi, close = if c_vol then na else pc_lo,
type = ChartType.CANDLE, growcolor = GlobalColor("c_pri_red"));
AddChart(high = if c_vol then na else pc_hi, low = pc_lo , open = pc_lo, close = if c_vol then na else pc_hi,
type = ChartType.CANDLE, growcolor = GlobalColor("b_pri_red"));

AddChart(high = if c_vol then vc_hi else na , low = vc_lo , open = vc_hi, close = if c_vol then vc_lo else na,
type = ChartType.CANDLE, growcolor = GlobalColor("c_vol_grn"));
AddChart(high = if c_vol then vc_hi else na , low = vc_lo , open = vc_lo, close = if c_vol then vc_hi else na,
type = ChartType.CANDLE, growcolor = GlobalColor("b_vol_grn"));

AddChart(high = if c_vol then na else vc_hi, low = vc_lo , open = vc_hi, close = if c_vol then na else vc_lo,
type = ChartType.CANDLE, growcolor = GlobalColor("c_vol_red"));
AddChart(high = if c_vol then na else vc_hi, low = vc_lo , open = vc_lo, close = if c_vol then na else vc_hi,
type = ChartType.CANDLE, growcolor = GlobalColor("b_vol_red"));


plot top_buffer = 125;
top_buffer.AssignValueColor(color.black);

plot bottom_buffer = -25;
bottom_buffer.AssignValueColor(color.black);

#--- END CODE
Last edited: