Moving Average Scalping Strategy For ThinkOrSwim

UpTwoBucks

EDUCATOR

Welcome to our ThinkScript tutorial where we explore the critical importance of creating custom buy and sell indicators based on your own unique trading strategy. In this video, we delve into the world of ThinkScript, a powerful scripting language used within ThinkorSwim, and discover how you can leverage its capabilities to gain a competitive edge in the financial markets.

Code:
# Created by Ricky_Gaspard 7-16-2023
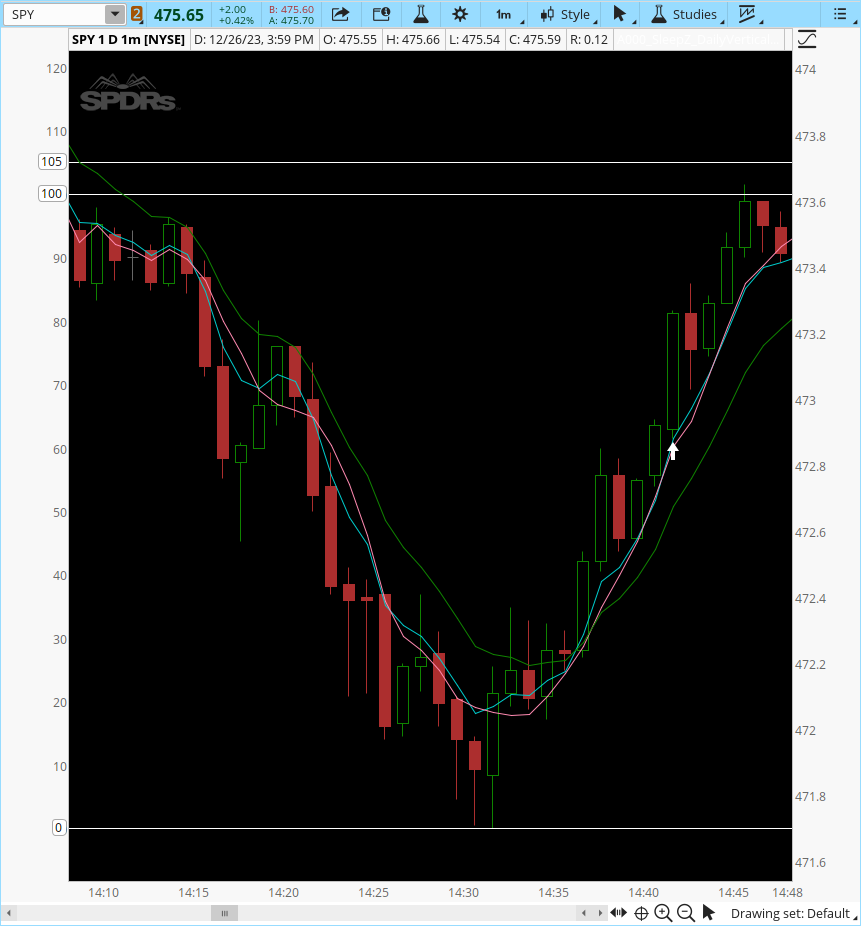
#Buying and Selling Indicator Arrows for Scalping

# Buying Conditions

def buycondition1 = SimpleMovingAvg("length" = 5)."SMA" is greater than MovAvgExponential("length" = 10)."AvgExp" and MovAvgExponential("length" = 5)."AvgExp" is greater than MovAvgExponential("length" = 10)."AvgExp" and MovAvgExponential("length" = 5)."AvgExp" crosses above SimpleMovingAvg("length" = 5)."SMA";

#def buycondition2 =

#Selling Conditions

def sellcondition1 = MovAvgExponential("length" = 5)."AvgExp" crosses below MovAvgExponential("length" = 10)."AvgExp";

#def sellcondition2 =

#Determies Conditions of an UP Arrow

plot bullish = if buycondition1 then 1 else 0;

#Determies Conditions of a Down Arrow

plot bearish = if sellcondition1 then 1 else 0;

#Paints Up Arrow On Chart

bullish.SetPaintingStrategy(PaintingStrategy.BOOLEAN_ARROW_UP);

#Sets Default UP Arrow Color

bullish.SetDefaultColor(Color.white);

#Paints Down Arrow On Chart

bearish.SetPaintingStrategy(PaintingStrategy.BOOLEAN_ARROW_DOWN);

#Sets Default Down Arrow Color

bearish.SetDefaultColor(Color.WHITE);

#Sets Thickness of Arrows

bullish.SetLineWeight(3);
bearish.SetLineWeight(3);

Current DeskTop: http://tos.mx/61uIJpH
 

Join useThinkScript to post your question to a community of 21,000+ developers and traders.

Have you tried a P/L with different Moving Averages? Some stocks respond better with different averages.
Absolutely. I don't think there is anything i haven't tried. I've been trading since 1990. This video was a request to show a simple method to build an indicator without knowing ThinkScript coding.
 
Last edited:
Ricky, this snip is from SPY on Friday, 12/22. I'm curious why no signal occurred at the sudden turn back up at around 1:30.
 

Attachments

  • SPY 2023-12-23 092331.png
    SPY 2023-12-23 092331.png
    10.7 KB · Views: 143
Ricky, this snip is from SPY on Friday, 12/22. I'm curious why no signal occurred at the sudden turn back up at around 1:30.
We are having some issues with indicators and scans and the migration from TD Ameritrade to Schwab. Some things I can't control. Keep an eye on it and keep me informed. I was logged out twice from Thinkorswim for some unknown reason. Really weird things happening to some of us. I was told I'm not migrating until spring. Hopefully this will be over soon.
 
Ricky, this snip is from SPY on Friday, 12/22. I'm curious why no signal occurred at the sudden turn back up at around 1:30.
@UpTwoBucks
The simple moving average will mirror the exponential moving average when price movement is within the normal distribution.

The premise of this indicator is that a cross between the sma5 and the ema5 signals an increase in momentum and a reversal of direction. Given that the ema5 is weighted more toward the recent bar activity.,


The problem with your "missing signal", is that Friday was a light trading day, momentum was a struggle to achieve. Therefore, as you can see from the linked chart:
the sma5 & the ema5 did not stray outside the normal curve; meaning that they did not cross at the reversal point and therefore no signal materialized.

shared chart link: http://tos.mx/2t7FWxd Click here for --> Easiest way to load shared links
ZerEyNc.png
I thought about that a while after I posted my query and drew the lines in just like you have above. It was clear to me then the dip was an anomaly that didn't cause the lines to cross, thus no signal. Thanks for getting back to me so quickly,
 
Absolutely. I don't think there is anything i haven't tried. I've been trading since 1990. This video was a request to show a simple method to build an indicator without knowing ThinkScript coding.
I know and understand everyone is different , but I like to ask questions to those that have experience. With that said, have you found yourself favoring ema indicators in your code/studies/indicators better than x# sma?
 

Not the exact question you're looking for?

Start a new thread and receive assistance from our community.

87k+ Posts
314 Online
Create Post

The Market Trading Game Changer

Join 2,500+ subscribers inside the useThinkScript VIP Membership Club
  • Exclusive indicators
  • Proven strategies & setups
  • Private Discord community
  • ‘Buy The Dip’ signal alerts
  • Exclusive members-only content
  • Add-ons and resources
  • 1 full year of unlimited support

Frequently Asked Questions

What is useThinkScript?

useThinkScript is the #1 community of stock market investors using indicators and other tools to power their trading strategies. Traders of all skill levels use our forums to learn about scripting and indicators, help each other, and discover new ways to gain an edge in the markets.

How do I get started?

We get it. Our forum can be intimidating, if not overwhelming. With thousands of topics, tens of thousands of posts, our community has created an incredibly deep knowledge base for stock traders. No one can ever exhaust every resource provided on our site.

If you are new, or just looking for guidance, here are some helpful links to get you started.

What are the benefits of VIP Membership?
VIP members get exclusive access to these proven and tested premium indicators: Buy the Dip, Advanced Market Moves 2.0, Take Profit, and Volatility Trading Range. In addition, VIP members get access to over 50 VIP-only custom indicators, add-ons, and strategies, private VIP-only forums, private Discord channel to discuss trades and strategies in real-time, customer support, trade alerts, and much more. Learn all about VIP membership here.
How can I access the premium indicators?
To access the premium indicators, which are plug and play ready, sign up for VIP membership here.
Back
Top