
here is my set up I have been using.
I use it for day trading and don't hold any positions overnight so that is why open and close at the start and end of the trading session.
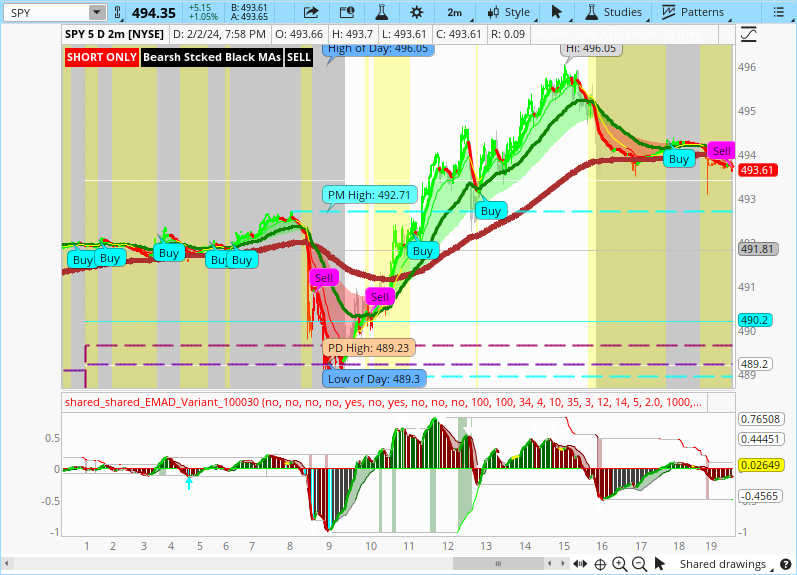
if candle closes above all 4 ema's, the 7,13, 48 and 200 then a position would be opened, if the candle is above all 4 ema's a call would be purchased, if it closes below all 4 ema's a put would be purchased.
If candle is between all 4 then no trade is open.
The trade is then closed as soon as the candle crosses the 13 ema.
see picture, my candles are gray when the candles are not above or below all of the ema's.
the arrows represent the 7 and 13 ema cross, that is my indication to open or close my position.
the arrow could trigger when the candle is still in between the ema's if that is the case it is opened as soon as it closes above or below all 4, then closed when the 7 and 13 ema cross.
if the trading session opens and all the criteria's are met that would open a new position at the start of the day, lets say I would open the position at 9:32.
http://tos.mx/CDXB2ux
I use it for day trading and don't hold any positions overnight so that is why open and close at the start and end of the trading session.
if candle closes above all 4 ema's, the 7,13, 48 and 200 then a position would be opened, if the candle is above all 4 ema's a call would be purchased, if it closes below all 4 ema's a put would be purchased.
If candle is between all 4 then no trade is open.
The trade is then closed as soon as the candle crosses the 13 ema.
see picture, my candles are gray when the candles are not above or below all of the ema's.
the arrows represent the 7 and 13 ema cross, that is my indication to open or close my position.
the arrow could trigger when the candle is still in between the ema's if that is the case it is opened as soon as it closes above or below all 4, then closed when the 7 and 13 ema cross.
if the trading session opens and all the criteria's are met that would open a new position at the start of the day, lets say I would open the position at 9:32.
http://tos.mx/CDXB2ux
Last edited by a moderator: