
Core_Laborer
New member
Updated: 09142023 [[[ (Below 09072023 Update) ]]]
Script For - Cumulative Volume (Input Symbol : $VOLD) Histogram (Inc. Weekly Vertical Lines) /w $VOLD [Chart] Line Plot Overlay
(Reference script has been changed due to recent progress.)
Time Frame - Chart (5Day 15Min)
Placement - Lower (Study)
UPDATED : 09072023
Due to my limited knowledge pertaining to thinkscript, I had early on adopted a puzzle-building approach to eventually achieve desired results - the current script in this update is an example of that approach.
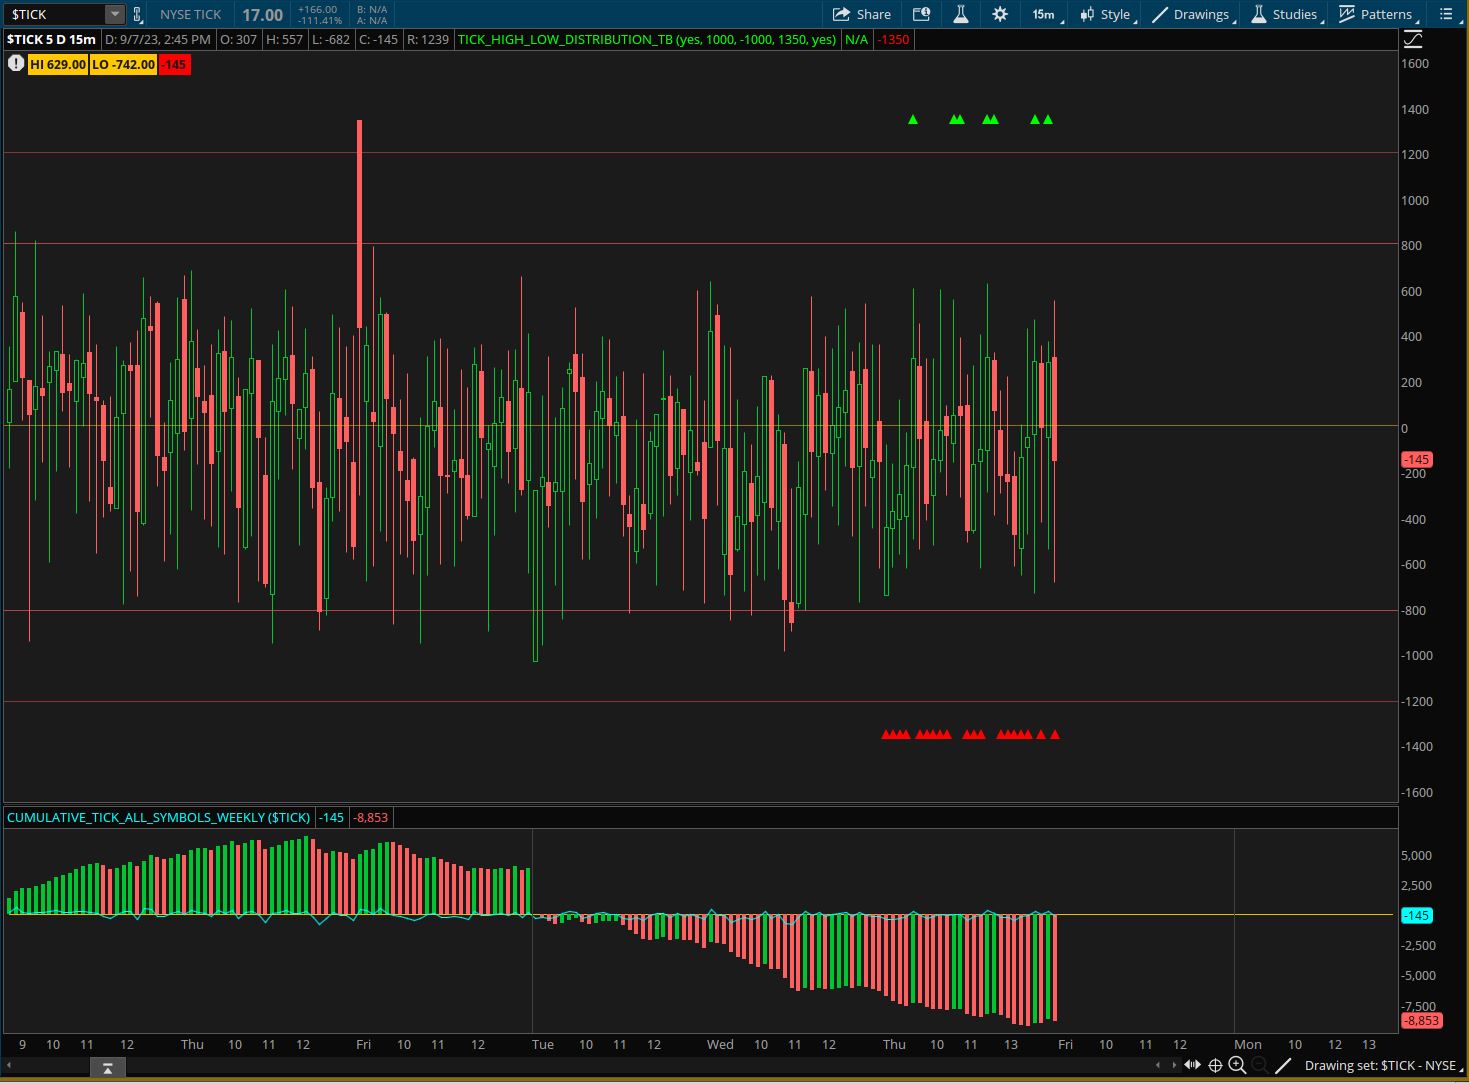
Although it is meant for visualization of daily $TICK accumulative data, changing it to represent a weekly histogram will hopefully assist in the understanding of what I am trying to accomplish.
Simply put, I would appreciate assistance in regards to converting this script to handle cumulative volume data with $VOLD as an input. I have recently been given the impression that it is not as "simple" as it would seem and am more than willing to do the work, ideally with some guidance and or pointing in the write direction.
I apologize for the "radical" nature of this recent update - it was a rather aggressive development, I hope it to be confirmed as productive.
Update: 09142023
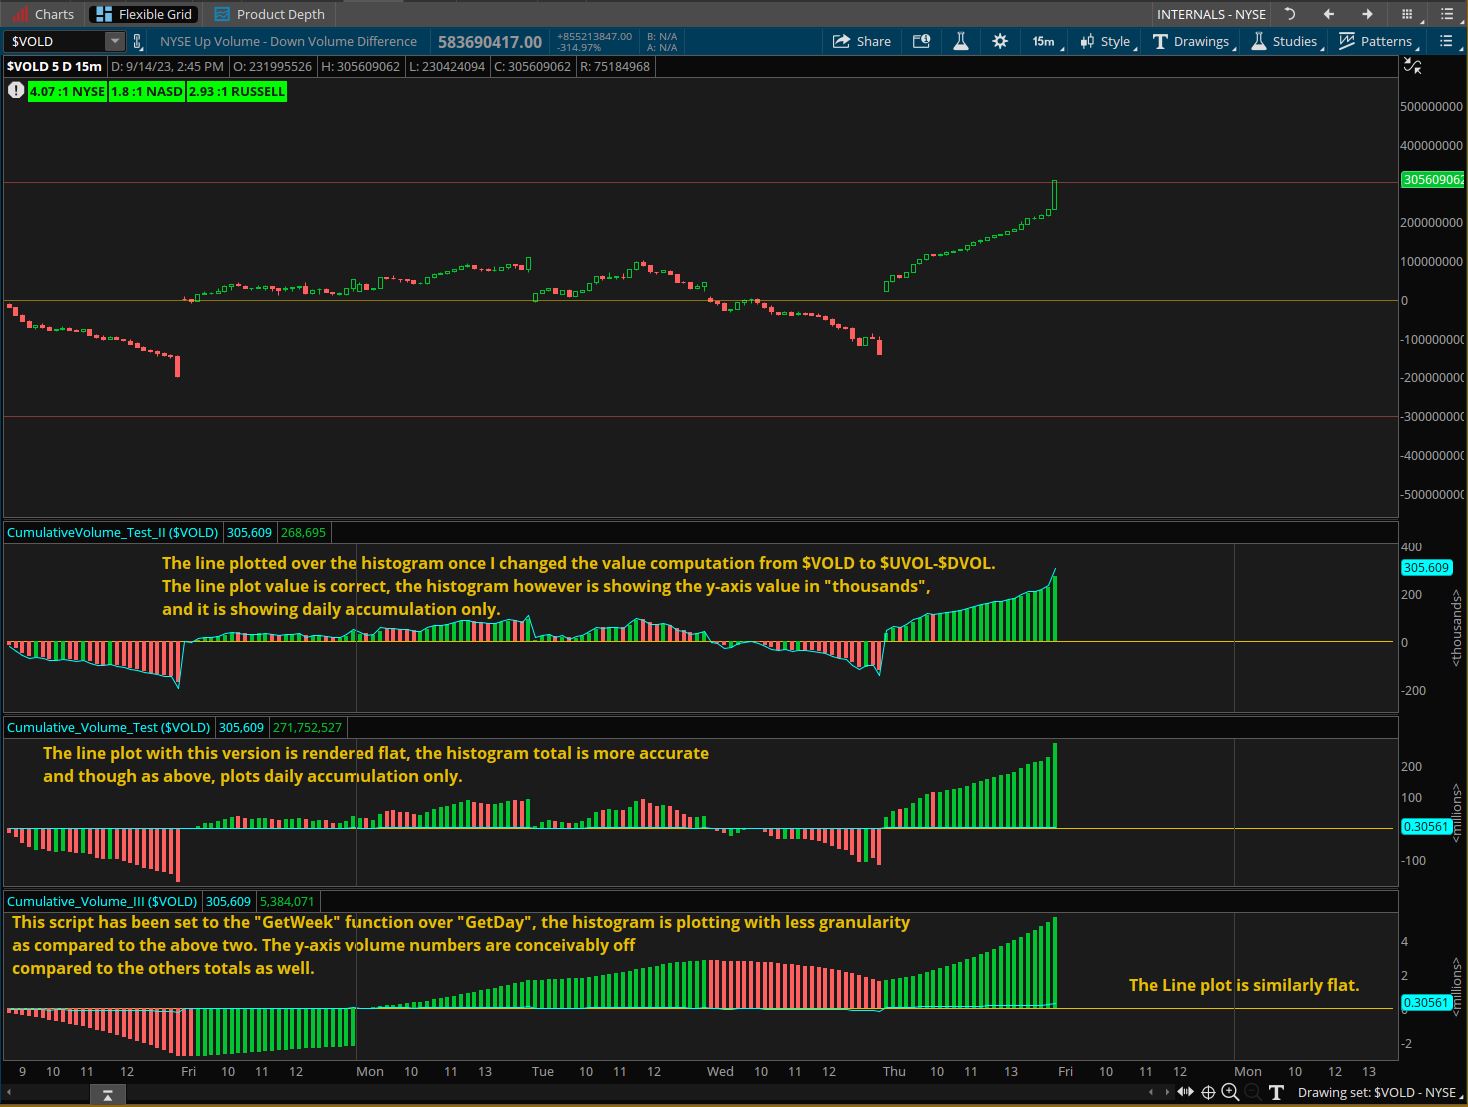
The following is a visual update and a list of three scripts, The names of the scripts are below the credits and will be listed in the same order they are displayed as indicators in the screenshot. The "Weekly" element still eludes me in this effort but a degree of modest progress in other areas has been made.
Keep in mind that all three of the below scripts are my attempts to achieve the end results described in the 9/7/23 Update - I am attempting to provide as much information as may be relevant. By showing what I have been working with, the obvious and or less obvious to me may be a glaring absence to another.
# Original Script Assembled by BenTen at useThinkScript.com
# Discussion https://usethinkscript.com/threads/vold-divergence-indicator-for-thinkorswim.715/
# In addition to various script segments made available by the useThinkScript.com community.
# Additional credit goes to TOSIndicators.com
############# CumulativeVolume_Test_II ###############
declare lower;
#def value = close("$VOLD");
def value = close("$UVOL")- close("$DVOL");
plot data = value;
data.SetPaintingStrategy(PaintingStrategy.LINE);
data.assignValueColor(color.CYAN);
input symbol_1 = "$VOLD";
def IsUp = close > open;
def IsDown = close < open;
def U = ohlc4 ("$UVOL");
def D = ohlc4("$DVOL");
def UDL = U - D;
plot volume;
def volume_confirm = UDL > UDL[5];
def volume_confirm2 = UDL > UDL[5];
volume.SetPaintingStrategy(paintingStrategy.HISTOGRAM);
if (GetUnderlyingSymbol() == Symbol_1)
{
volume = UDL;
}
else
{
volume = double.nan;
}
volume.AssignValueColor(if Close < Open then Color.DOWNTICK
else if Close > Open then Color.UPTICK else color.DOWNTICK);
volume.SetLineWeight(4);
def newWeek = GetWeek() != GetWeek()[1];
AddVerticalLine(newWeek, "", color.DARK_GRAY, curve.FIRM);
plot zero = 0;
zero.AssignValueColor(GetColor(4));
zero.HideBubble();
zero.HideTitle();
############## CumulativeVolume_Test ################
declare lower;
def value = close("$UVOL")- close("$DVOL");
plot data = value;
data.SetPaintingStrategy(PaintingStrategy.LINE);
data.assignValueColor(color.CYAN);
input symbol = "$VOLD";
def IsUp = close > open;
def IsDown = close < open;
#def V = volume;
def O = open;
def H = high;
def L = low;
def C = close;
def U = ohlc4("$UVOL");
def D = ohlc4("$DVOL");
def UDL = U - D;
def Volume = ohlc4 ("$VOLD");
def VolumeData = UDL;
rec CT = if GetDay() != GetDay()[1] then 0 else if SecondsTillTime(930) < 0 and SecondsTillTime(1600) > 0 then CT[1] + VolumeData else 0;
plot cumulativeVolume = if !IsNaN(Volumedata) then CT[1] + Volume else Double.NaN;
cumulativeVolume.SetPaintingStrategy(PaintingStrategy.HISTOGRAM);
cumulativeVolume.AssignValueColor(if Close < Open then Color.DOWNTICK
else if Close > Open then Color.UPTICK else color.DOWNTICK);
############## CumulativeVolume_Test III ################
declare lower;
def value = close("$UVOL")- close("$DVOL");
plot data = value;
data.SetPaintingStrategy(PaintingStrategy.LINE);
data.assignValueColor(color.CYAN);
def IsUp = close > open;
def IsDown = close < open;
def U = close ("$UVOL");
def D = close("$DVOL");
def UDL = U - D;
input symbol = "$VOLD";
def VolData = close(symbol = "$VOLD");
def CumulativeVolData = if GetWeek() != GetWeek()[1] then 0 else if SecondsTillTime(930) <= 0 and SecondsTillTime(1600) >= 0 then UDL + CumulativeVolData[1] else 0;
plot CumulativeVolPlot = if CumulativeVolData != 0 then CumulativeVolData else Double.NaN;
CumulativeVolPlot.SetPaintingStrategy(PaintingStrategy.HISTOGRAM);
CumulativeVolPlot.AssignValueColor(if CumulativeVolData < CumulativeVolData [1] then Color.DOWNTICK else Color.UPTICK);
Script For - Cumulative Volume (Input Symbol : $VOLD) Histogram (Inc. Weekly Vertical Lines) /w $VOLD [Chart] Line Plot Overlay
(Reference script has been changed due to recent progress.)
Time Frame - Chart (5Day 15Min)
Placement - Lower (Study)
UPDATED : 09072023
Due to my limited knowledge pertaining to thinkscript, I had early on adopted a puzzle-building approach to eventually achieve desired results - the current script in this update is an example of that approach.
Although it is meant for visualization of daily $TICK accumulative data, changing it to represent a weekly histogram will hopefully assist in the understanding of what I am trying to accomplish.
Simply put, I would appreciate assistance in regards to converting this script to handle cumulative volume data with $VOLD as an input. I have recently been given the impression that it is not as "simple" as it would seem and am more than willing to do the work, ideally with some guidance and or pointing in the write direction.
I apologize for the "radical" nature of this recent update - it was a rather aggressive development, I hope it to be confirmed as productive.
Code:
#CUMULATIVE_TICK_ALL_SYMBOLS_WEEKLY

#TICK Symbols List:

#$TICK – NYSE
#$TICK/Q – Nasdaq
#$TIKA – Amex
#$TICKAC – Amex composite
#$TICKAR – ARCA
#$TICKARC – ARCA composite
#$TICKC – NYSE composite
#$TICKC/Q – Nasdaq composite
#$TIKI – DJIA
#$TIKIC – DJIA composite
#$TIKND – Nasdaq 100
#$TIKNDC – Nasdaq 100 composite
#$TIKRL – Russell 2000
#$TIKRLC – Russell 2000 composite
#$TIKSP – S&P 500
#$TIKSPC – S&P 500 composite
#$TIKUS – All USA
#$TIKUSC – All USA composite

declare lower;

def value = close("$TICK");
plot data = value;
data.SetPaintingStrategy(PaintingStrategy.LINE);
data.assignValueColor(color.CYAN);

input symbol = "$TICK";

def tickData = close("$TICK");
rec CT = if GetWeek() != GetWeek()[1] then 0 else if SecondsTillTime(930) <= 0 and SecondsTillTime(1600) >= 0 then CT[1] + tickData else 0;
plot cumulativeTick = if !IsNaN(tickData) then CT else Double.NaN ;

cumulativeTick.SetPaintingStrategy(PaintingStrategy.HISTOGRAM);

cumulativeTick.AssignValueColor(if cumulativeTick < cumulativeTick [1] then Color.DOWNTICK
else Color.UPTICK);

cumulativeTick.SetLineWeight(4);

def newWeek = GetWeek() != GetWeek()[1];
AddVerticalLine(newWeek, "", color.DARK_GRAY, curve.FIRM);

plot zero = 0;
zero.AssignValueColor(GetColor(4));
zero.HideBubble();
zero.HideTitle();
Update: 09142023
The following is a visual update and a list of three scripts, The names of the scripts are below the credits and will be listed in the same order they are displayed as indicators in the screenshot. The "Weekly" element still eludes me in this effort but a degree of modest progress in other areas has been made.
Keep in mind that all three of the below scripts are my attempts to achieve the end results described in the 9/7/23 Update - I am attempting to provide as much information as may be relevant. By showing what I have been working with, the obvious and or less obvious to me may be a glaring absence to another.
# Original Script Assembled by BenTen at useThinkScript.com
# Discussion https://usethinkscript.com/threads/vold-divergence-indicator-for-thinkorswim.715/
# In addition to various script segments made available by the useThinkScript.com community.
# Additional credit goes to TOSIndicators.com
############# CumulativeVolume_Test_II ###############
declare lower;
#def value = close("$VOLD");
def value = close("$UVOL")- close("$DVOL");
plot data = value;
data.SetPaintingStrategy(PaintingStrategy.LINE);
data.assignValueColor(color.CYAN);
input symbol_1 = "$VOLD";
def IsUp = close > open;
def IsDown = close < open;
def U = ohlc4 ("$UVOL");
def D = ohlc4("$DVOL");
def UDL = U - D;
plot volume;
def volume_confirm = UDL > UDL[5];
def volume_confirm2 = UDL > UDL[5];
volume.SetPaintingStrategy(paintingStrategy.HISTOGRAM);
if (GetUnderlyingSymbol() == Symbol_1)
{
volume = UDL;
}
else
{
volume = double.nan;
}
volume.AssignValueColor(if Close < Open then Color.DOWNTICK
else if Close > Open then Color.UPTICK else color.DOWNTICK);
volume.SetLineWeight(4);
def newWeek = GetWeek() != GetWeek()[1];
AddVerticalLine(newWeek, "", color.DARK_GRAY, curve.FIRM);
plot zero = 0;
zero.AssignValueColor(GetColor(4));
zero.HideBubble();
zero.HideTitle();
############## CumulativeVolume_Test ################
declare lower;
def value = close("$UVOL")- close("$DVOL");
plot data = value;
data.SetPaintingStrategy(PaintingStrategy.LINE);
data.assignValueColor(color.CYAN);
input symbol = "$VOLD";
def IsUp = close > open;
def IsDown = close < open;
#def V = volume;
def O = open;
def H = high;
def L = low;
def C = close;
def U = ohlc4("$UVOL");
def D = ohlc4("$DVOL");
def UDL = U - D;
def Volume = ohlc4 ("$VOLD");
def VolumeData = UDL;
rec CT = if GetDay() != GetDay()[1] then 0 else if SecondsTillTime(930) < 0 and SecondsTillTime(1600) > 0 then CT[1] + VolumeData else 0;
plot cumulativeVolume = if !IsNaN(Volumedata) then CT[1] + Volume else Double.NaN;
cumulativeVolume.SetPaintingStrategy(PaintingStrategy.HISTOGRAM);
cumulativeVolume.AssignValueColor(if Close < Open then Color.DOWNTICK
else if Close > Open then Color.UPTICK else color.DOWNTICK);
############## CumulativeVolume_Test III ################
declare lower;
def value = close("$UVOL")- close("$DVOL");
plot data = value;
data.SetPaintingStrategy(PaintingStrategy.LINE);
data.assignValueColor(color.CYAN);
def IsUp = close > open;
def IsDown = close < open;
def U = close ("$UVOL");
def D = close("$DVOL");
def UDL = U - D;
input symbol = "$VOLD";
def VolData = close(symbol = "$VOLD");
def CumulativeVolData = if GetWeek() != GetWeek()[1] then 0 else if SecondsTillTime(930) <= 0 and SecondsTillTime(1600) >= 0 then UDL + CumulativeVolData[1] else 0;
plot CumulativeVolPlot = if CumulativeVolData != 0 then CumulativeVolData else Double.NaN;
CumulativeVolPlot.SetPaintingStrategy(PaintingStrategy.HISTOGRAM);
CumulativeVolPlot.AssignValueColor(if CumulativeVolData < CumulativeVolData [1] then Color.DOWNTICK else Color.UPTICK);
Last edited: