
G
guest
Guest
The author states:
Multiple Wicks forming at OverSold & OverBought levels create Buying and Selling Pressure. This Script tries to capture the essence of the buy and sell pressure created by those wicks. Wick pressure shows that the trend is Exhausted.
How it works:
This Wick Pressure Indicator checks for three candles forming the wicks in overbought and oversold zones. The zones are set by RSI and can be changed in settings. Those three candles should form a bit long wick and length of the wick is determined by ATR. The ATR multiple can be changed from settings. And then the script draws a box in the area formed by three candle wicks.
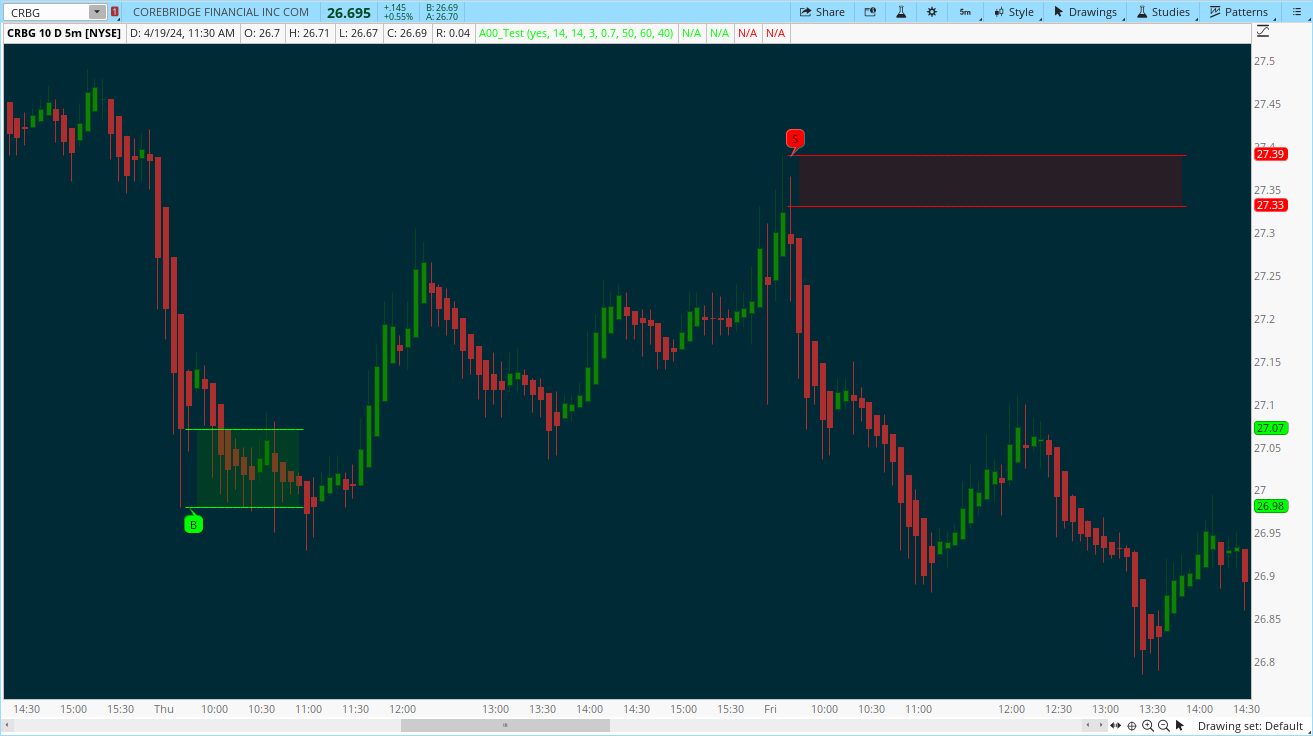
Found this really cool script from trading view and would like to test on TOS.
https://www.tradingview.com/script/w2sPsVff-Wick-Pressure-by-SiddWolf/
@samer800 is it possible to convert this to TOS?
Multiple Wicks forming at OverSold & OverBought levels create Buying and Selling Pressure. This Script tries to capture the essence of the buy and sell pressure created by those wicks. Wick pressure shows that the trend is Exhausted.
How it works:
This Wick Pressure Indicator checks for three candles forming the wicks in overbought and oversold zones. The zones are set by RSI and can be changed in settings. Those three candles should form a bit long wick and length of the wick is determined by ATR. The ATR multiple can be changed from settings. And then the script draws a box in the area formed by three candle wicks.
Found this really cool script from trading view and would like to test on TOS.
https://www.tradingview.com/script/w2sPsVff-Wick-Pressure-by-SiddWolf/
@samer800 is it possible to convert this to TOS?
Last edited by a moderator: