Why Are There No Double-Bottom Scans

VR555

Active member
VIP
A couple of searches for a scan for double bottoms has only shown indicators. Are there any scans for double bottoms on this site, or is the one built into thinkorswim the best?
 

Join useThinkScript to post your question to a community of 21,000+ developers and traders.

The double bottom indicators on the forum are repainters
https://usethinkscript.com/search/2552326/?q=double+bottom&c[title_only]=1&o=date

No, the forum does not support repainting scans
No there are no non-repainting double bottom studies, as the repainting logic is required.

The Problem:
There is no way of identifying that the low is the bottom until long after that bottom formed.
Sadly, confirming that the bottom formed last week, is not what daytraders are seeking.
They want to know that the double-bottom is forming now.

The Solution:
Repainters identify every new low as the bottom, in hopes that this is where the bleed ends.
When it is not, it erases that point, riding it down to the next tick, and identifies that as the bottom.
This is helpful for daytraders, who use this as immediate confirmation to their other indicators that are lining up; that a potential reversal is forming.

Meanwhile a scan would trigger on every downward tick, rendering its usefulness less than optimal.

Best usecase for repainters: use your other non-repainting indicators that are lining up as your scan filter and then review your chart for the double-bottom as confirmation.
 
Last edited by a moderator:
The one I’m referring to is in Scan Hacker > Add Filter > Patterns > Double Bottoms. That may not be exactly right since I’m operating from memory, but it should be pretty close to show what I mean. Thank you, as always, for your help.
 
ThinkOrSwim does not provide the ability to view or edit the underlying ThinkScript pattern code for the double-bottom filter.
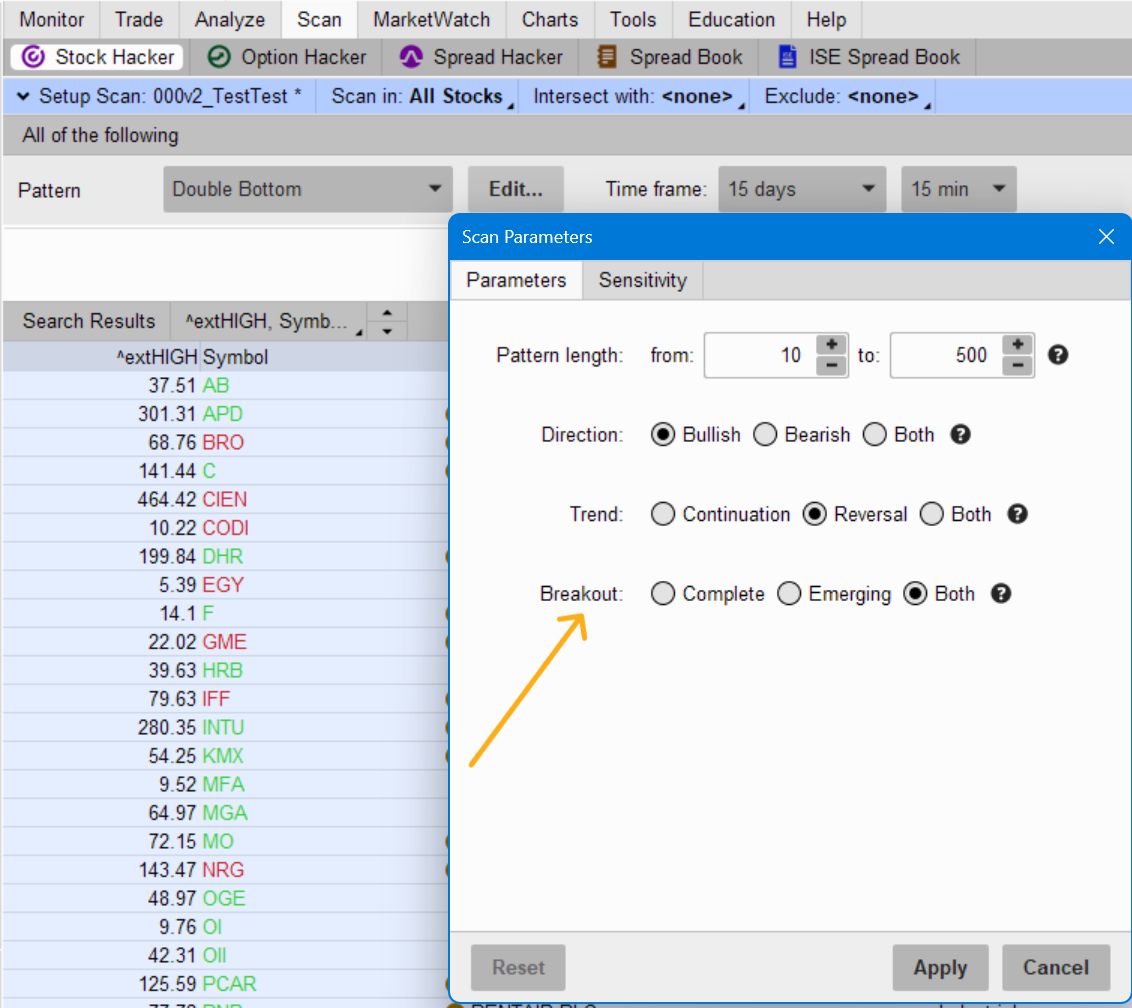
When you click "Edit" on a Pattern filter in the Stock Hacker scan tab, you are only allowed to modify the GUI parameters (Pattern length, Direction, Trend, Breakout).​


To answer your core question:
The code powering this built-in pattern is proprietary and hardcoded into the platform's backend.
Therefore, there is no way to know whether it is repainting.

Hazarding A Guess:
In the editable parameters, you see breakout: complete or emerging
zQ7jIPs.png

Perhaps that could mean that the complete-type is a lagging identification of historical double bottoms? and
emerging-type would more likely be repainting attempts at current double bottoms?


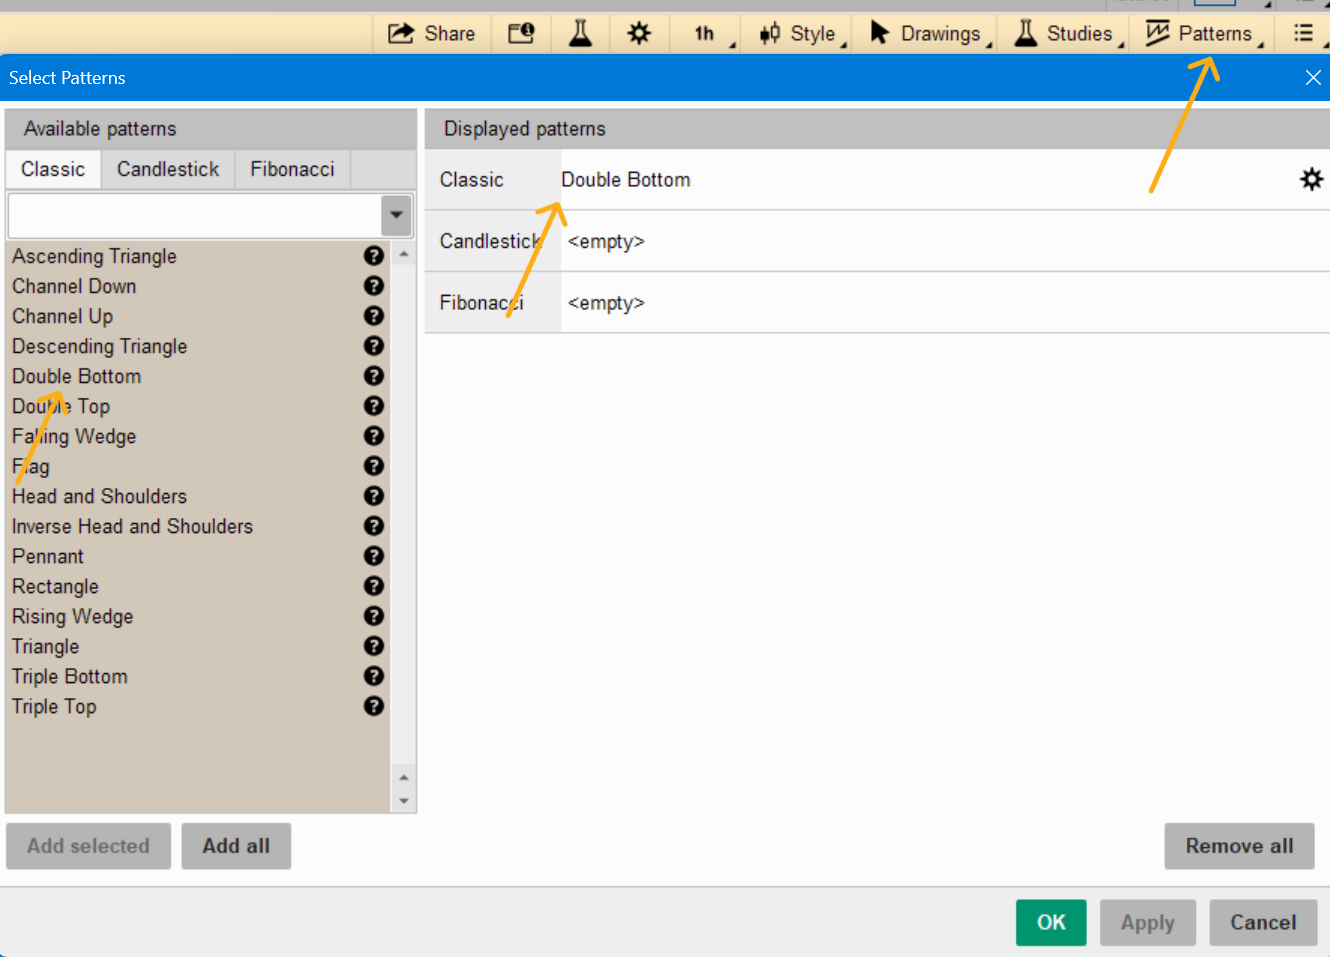
When you add this pattern to your chart, what type of behavior do you see?
NV1jm3j.png
 
Last edited by a moderator:
The one I’m referring to is in Scan Hacker > Add Filter > Patterns > Double Bottoms. That may not be exactly right since I’m operating from memory, but it should be pretty close to show what I mean. Thank you, as always, for your help.
Try this - start with broad scan and then narrow yourself or scan with another scanner like we were talking about in another post-
Code:
input lowLookback = 40;
input tolerancePct = 3.0;
input reboundMinPct = 5.0;
input shortMA = 21;

def c = close;
def h = high;
def l = low;
def ma = ExpAverage(c, shortMA);

def priorLow = Lowest(l[10], lowLookback);
def pctFromPriorLow = 100 * (c - priorLow) / priorLow;
def nearPriorLow = AbsValue(100 * (l - priorLow) / priorLow) <= tolerancePct;

def reboundAfterLow = Highest(h, 10) >= priorLow * (1 + reboundMinPct / 100);
def structureRepair = c > ma;

plot scan = nearPriorLow and reboundAfterLow and structureRepair;

What this is doing
It tries to avoid random falling knives by requiring:

  • a prior low exists
  • price revisits that zone
  • there was at least some rebound off the first low
  • price is starting to repair above short-term structure
This still may catch some sloppy names in broad ranges. That is why I’d rank them with additional columns.

Scan B: Undercut and reclaim​

This is the stronger one.
Code:
input lowLookback = 40;
input undercutPct = 2.0;
input reclaimMA = 10;

def c = close;
def l = low;
def priorLow = Lowest(l[5], lowLookback);
def undercut = l < priorLow and l >= priorLow * (1 - undercutPct / 100);
def reclaimed = c > priorLow;
def aboveShortMA = c > Average(c, reclaimMA);

plot scan = undercut and reclaimed and aboveShortMA;

This captures a very tradeable pattern family:
  • prior low tested
  • sellers pushed it marginally lower
  • stock reclaimed the low
  • right-side repair has begun
That often matters more than finding two mathematically equal lows.

Scan C: Higher-low repair​

This is for stronger names that do not need a full retest.

Code:
input lookback1 = 30;
input lookback2 = 10;
input shortMA = 21;
input longMA = 50;

def c = close;
def l = low;
def maShort = ExpAverage(c, shortMA);
def maLong = Average(c, longMA);

def leftLow = Lowest(l[lookback2], lookback1);
def recentLow = Lowest(l, lookback2);

def higherLow = recentLow > leftLow * 1.02;
def repaired = c > maShort and maShort >= maLong * 0.98;

plot scan = higherLow and repaired;

A lot of the best swing names do not print a clean second bottom. They just stop going down, print a higher low, and repair. You want those too.
 
Try this - start with broad scan and then narrow yourself or scan with another scanner like we were talking about in another post-
Code:
input lowLookback = 40;
input tolerancePct = 3.0;
input reboundMinPct = 5.0;
input shortMA = 21;

def c = close;
def h = high;
def l = low;
def ma = ExpAverage(c, shortMA);

def priorLow = Lowest(l[10], lowLookback);
def pctFromPriorLow = 100 * (c - priorLow) / priorLow;
def nearPriorLow = AbsValue(100 * (l - priorLow) / priorLow) <= tolerancePct;

def reboundAfterLow = Highest(h, 10) >= priorLow * (1 + reboundMinPct / 100);
def structureRepair = c > ma;

plot scan = nearPriorLow and reboundAfterLow and structureRepair;

What this is doing
It tries to avoid random falling knives by requiring:

  • a prior low exists
  • price revisits that zone
  • there was at least some rebound off the first low
  • price is starting to repair above short-term structure
This still may catch some sloppy names in broad ranges. That is why I’d rank them with additional columns.

Scan B: Undercut and reclaim​

This is the stronger one.
Code:
input lowLookback = 40;
input undercutPct = 2.0;
input reclaimMA = 10;

def c = close;
def l = low;
def priorLow = Lowest(l[5], lowLookback);
def undercut = l < priorLow and l >= priorLow * (1 - undercutPct / 100);
def reclaimed = c > priorLow;
def aboveShortMA = c > Average(c, reclaimMA);

plot scan = undercut and reclaimed and aboveShortMA;

This captures a very tradeable pattern family:
  • prior low tested
  • sellers pushed it marginally lower
  • stock reclaimed the low
  • right-side repair has begun
That often matters more than finding two mathematically equal lows.

Scan C: Higher-low repair​

This is for stronger names that do not need a full retest.

Code:
input lookback1 = 30;
input lookback2 = 10;
input shortMA = 21;
input longMA = 50;

def c = close;
def l = low;
def maShort = ExpAverage(c, shortMA);
def maLong = Average(c, longMA);

def leftLow = Lowest(l[lookback2], lookback1);
def recentLow = Lowest(l, lookback2);

def higherLow = recentLow > leftLow * 1.02;
def repaired = c > maShort and maShort >= maLong * 0.98;

plot scan = higherLow and repaired;

A lot of the best swing names do not print a clean second bottom. They just stop going down, print a higher low, and repair. You want those too.

Are these put into an existing scan as an additional filter?
 
I now have 12 scans that you have been very kind and generous to share recently. My challenge is deciding which ones to spend most of my effort on. Any guidance/advice on these scans would be much appreciated.
(PS - I'm posting this on the thread about 'Forex...' too since we've been working in both, to give a better chance for you to see soon)
 

Similar threads

Not the exact question you're looking for?

Start a new thread and receive assistance from our community.

87k+ Posts
1722 Online
Create Post

Similar threads

Similar threads

The Market Trading Game Changer

Join 2,500+ subscribers inside the useThinkScript VIP Membership Club
  • Exclusive indicators
  • Proven strategies & setups
  • Private Discord community
  • ‘Buy The Dip’ signal alerts
  • Exclusive members-only content
  • Add-ons and resources
  • 1 full year of unlimited support

Frequently Asked Questions

What is useThinkScript?

useThinkScript is the #1 community of stock market investors using indicators and other tools to power their trading strategies. Traders of all skill levels use our forums to learn about scripting and indicators, help each other, and discover new ways to gain an edge in the markets.

How do I get started?

We get it. Our forum can be intimidating, if not overwhelming. With thousands of topics, tens of thousands of posts, our community has created an incredibly deep knowledge base for stock traders. No one can ever exhaust every resource provided on our site.

If you are new, or just looking for guidance, here are some helpful links to get you started.

What are the benefits of VIP Membership?
VIP members get exclusive access to these proven and tested premium indicators: Buy the Dip, Advanced Market Moves 2.0, Take Profit, and Volatility Trading Range. In addition, VIP members get access to over 50 VIP-only custom indicators, add-ons, and strategies, private VIP-only forums, private Discord channel to discuss trades and strategies in real-time, customer support, trade alerts, and much more. Learn all about VIP membership here.
How can I access the premium indicators?
To access the premium indicators, which are plug and play ready, sign up for VIP membership here.
Back
Top