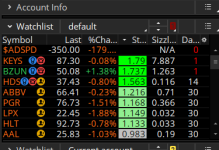
What is Options Sizzle Index in ThinkorSwim? How to Use It

markos

Well-known member
VIP

Sizzle Indexes

Here are two screenshots stitched together to show the option based sizzle indexes for a watchlist. 10/22/19

Please note that the “stock sizzle” which is not shown here, and only available on desktop, is adjustable by number of days.

OyFN3N2.png


The option sizzle indexes are set to show, in percentage terms, what the volume in the options market are trading vs their 5 day moving average.
(The 5 days are not changeable.)

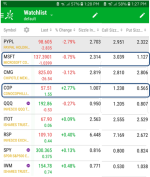
Let’s take Microsoft as an example. At the time of this screenshot, Microsoft traded 2.314 times more option volume than it had the previous 5 days. What that 5 day amount was is all relative.

The number of Calls traded was 3.039 times the 5 day average of MSFT Calls.
The number of Puts traded was 1.127 times the 5 day average of MSFT Puts.

It is important to remember that these are just clues as to what is going on in the option market. We do know that MSFT options were trading in higher volume than they were in the previous 5 days. We also know that there was much more activity in Call Options than there was in Put Options.

Why? We don’t know. If we did, we’d be Gazillionaires!
We also don’t know from these indexes whether it was buying or selling of these option contracts. Again, refer to the previous sentence.

Now COP: What I think I can tell is in the COP options there were 1.238 in Calls vs 0.565 in Puts traded AND the stock was up 2.77% for the day.

If the stock is up a large percentage, it makes sense to me that Call option volume would be higher as well. Whether BOT or SOLD, I would tend to look into the option chain and see if there is something to act on. What, exactly, is up to you!
 

Attachments

  • OyFN3N2.png
    OyFN3N2.png
    119 KB · Views: 170
Last edited by a moderator:

Join useThinkScript to post your question to a community of 21,000+ developers and traders.

To tag along with Sizzle we have zero idea if there are spreads on of any kind either. All you have is an idea of interest v 5 days. Most large option moves do not have alternate straddles or spreads. If somebody —- especially big dinero —- knows something they aren’t wasting money on the other side of a position. Plus allot of large buys are camouflaged ... buys are spread out. I’ve used options as a proxy for owning individual equity shares based off a well known pattern like C&H or MeasuredMove backed by a Sizzle scan and studies with decent results. All the best.
 
I been using sizzle and tracking it for quite a long time. I use it to tell me if there is interest in the stock - kinda like relative volume. basically "stocks in play". Most of my intraday scanners filter for szl >2. It is easy and simple to add. However sizzle by itself will tell you nothing else about the direction of move or whether it will happen at all. Just a good way to filter out stocks which very likely to do absolutely nothing.

However I must point out there are some stocks (XLU, XLRE ones ) which can make nice intraday trends without any increasing in szl (and volume).
Large caps have lower sizzle on average. Most high fliers with szl >4 are ones with catalyst. Something like 50+ is usualy midcap with strong catalyst. Also sizzle tends to fluctuate during the day ( with options flow) but there is no way to parse or graph this information (TOS does not expose it)

all in all I think szl is good and simple additional filter to narrow down stock universe but by itself its not sufficient
 
For your 2 columns, what's the difference between Stock Sizzle and Sizzle Index. I was reading the TOS learning center so I have an idea about "sizzle index". thanks so much

Markos, do you customize it when you add the column? I get it that you can customize it for different scans, but wondering how you can customize it for the column?
 
Ok then, if sizzle is just puts vs calls...has anyone seen a good TOS script for relative-volume for the first hour of the day? I mean...comparing the first hour with the last twenty FIRST HOUR OF THE DAY. The first hour is almost always above average, so that doesn't count. It must be compared to previous "first hours". Not the last 20 hours of trading. The script must be here somewhere.
 
so, i was navigating TOS and i noticed the following: the sizzle index. for those who aren't familiar with it , it shows the daily total calls/puts versus the average of the last five days calls/puts. so if the sizzle index is over 1 it means that there are more contracts today comparing to the average of the last five days. furthermore, you can break it down to calls sizzle index and put sizzle index to see exactly which contracts are being bought on a specific day and how sizzling they are. my question is: based on your experience and trading, how much impact does these indices have on the price action and could they be reliable in choosing the direction of the stock price?
also, is it possible to incorporate these indices with technical analysis to predict price direction?
please feel free to express ur views. thx
 
Hi @cherif Please fill out your signature. What type of investor are you and for how long have you been doing it?
M5j106R.png


Here is an example of my Watchlist. Stock Sizzle, Sizzle Index, and Days till Earnings are the last 3. They are all built in. Stock Sizzle can be customized.

The first part of your question is backwards; the sizzle indexes do not impact price action, they show what current action is compared to, say, 5 days ave, in the case of Sizzle Index. Same with the Put or Call Sizzle Index.
The rub is that you only have volume for the options, not whether they were being bought or sold. IMO, they have little to do with price direction.
We have 2 things to hang our hat on; Price and Volume and they are used to make most indicators. They cannot be used to predict price direction.
All we have are possibilities and probabilities. That comes from study and observation.

Anyone else? Please add your 2 cents!
 

Attachments

  • M5j106R.png
    M5j106R.png
    39.2 KB · Views: 139
Last edited:
Thank you for your reply. So the question that remains unanswered is what is the purpose of having a sizzle index on one’s watchlist?
Now, if the sizzling index cannot predict future movements, how come major trading institutions keep an eye on $PCALL to initiate reversals??
Also, when $TRIN touches extremes, it signals reversals and indicates OB/OS levels of the market.
My thesis is why we all strive to make tech analysis relevant on intraday and daily trading, big liquidity uses internals to make moves on the market while the individual trader is left out.
 
Currently it can be scanned for but this doesn't allow you to visualize historical values of sizzle and the connection it had to price as you would on a chart. Does anyone have any lower study that gives a single line of data that represents the sizzle. This can be all option sizzle or individual call/put. I think it would complement the strategy I'm working on nicely.
 
Hi Guys !!!
I see some of you using the stock sizzle in TOS.
But I cant find it in TOS , I see only the stock index.

It was removed or something ?
 
@nervo88 What is exactly is the "stock sizzle" that you're looking for?

According to ThinkorSwim, the Sizzle Index "allows you to find stock symbols that currently see an increase in the number of options traded compared to the last five days’ average."

You can learn more about it here.
 
What is the code for the Days Till Earnings column in your watchlist? Do you by chance have the label for the chart too?
 
How do I add "stock sizzle"? It doesn't exist in tos. I see only sizzle index, volsizzle, put sizzle and call sizzle when I search for sizzle... Many thanks.
 

Similar threads

Not the exact question you're looking for?

Start a new thread and receive assistance from our community.

87k+ Posts
565 Online
Create Post

Similar threads

Similar threads

The Market Trading Game Changer

Join 2,500+ subscribers inside the useThinkScript VIP Membership Club
  • Exclusive indicators
  • Proven strategies & setups
  • Private Discord community
  • ‘Buy The Dip’ signal alerts
  • Exclusive members-only content
  • Add-ons and resources
  • 1 full year of unlimited support

Frequently Asked Questions

What is useThinkScript?

useThinkScript is the #1 community of stock market investors using indicators and other tools to power their trading strategies. Traders of all skill levels use our forums to learn about scripting and indicators, help each other, and discover new ways to gain an edge in the markets.

How do I get started?

We get it. Our forum can be intimidating, if not overwhelming. With thousands of topics, tens of thousands of posts, our community has created an incredibly deep knowledge base for stock traders. No one can ever exhaust every resource provided on our site.

If you are new, or just looking for guidance, here are some helpful links to get you started.

What are the benefits of VIP Membership?
VIP members get exclusive access to these proven and tested premium indicators: Buy the Dip, Advanced Market Moves 2.0, Take Profit, and Volatility Trading Range. In addition, VIP members get access to over 50 VIP-only custom indicators, add-ons, and strategies, private VIP-only forums, private Discord channel to discuss trades and strategies in real-time, customer support, trade alerts, and much more. Learn all about VIP membership here.
How can I access the premium indicators?
To access the premium indicators, which are plug and play ready, sign up for VIP membership here.
Back
Top