Sizzle Indexes
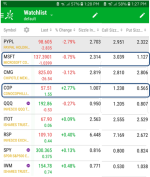
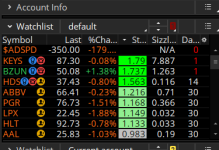
Here are two screenshots stitched together to show the option based sizzle indexes for a watchlist. 10/22/19Please note that the “stock sizzle” which is not shown here, and only available on desktop, is adjustable by number of days.
The option sizzle indexes are set to show, in percentage terms, what the volume in the options market are trading vs their 5 day moving average.
(The 5 days are not changeable.)
Let’s take Microsoft as an example. At the time of this screenshot, Microsoft traded 2.314 times more option volume than it had the previous 5 days. What that 5 day amount was is all relative.
The number of Calls traded was 3.039 times the 5 day average of MSFT Calls.
The number of Puts traded was 1.127 times the 5 day average of MSFT Puts.
It is important to remember that these are just clues as to what is going on in the option market. We do know that MSFT options were trading in higher volume than they were in the previous 5 days. We also know that there was much more activity in Call Options than there was in Put Options.
Why? We don’t know. If we did, we’d be Gazillionaires!
We also don’t know from these indexes whether it was buying or selling of these option contracts. Again, refer to the previous sentence.
Now COP: What I think I can tell is in the COP options there were 1.238 in Calls vs 0.565 in Puts traded AND the stock was up 2.77% for the day.
If the stock is up a large percentage, it makes sense to me that Call option volume would be higher as well. Whether BOT or SOLD, I would tend to look into the option chain and see if there is something to act on. What, exactly, is up to you!
Attachments
Last edited by a moderator:


