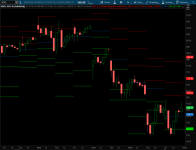
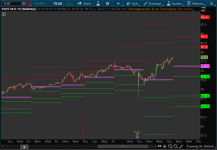
Here is an indicator that plot daily, weekly, and monthly pivot point along with some support and resistance lines on your ThinkorSwim chart.

thinkScript Code
Rich (BB code):
# WeeklyMonthlyPivots_TS
# http://thinkscripter.wordpress.com
# [email protected]
# Last Update 20 APR 2009

input timeFrame = {default WEEK, MONTH};
input showOnlyToday = no;

def H = high(period = timeFrame)[1];
def L = low(period = timeFrame)[1];
def C = close(period = timeFrame)[1];

def calc_PP = (H + L + C) / 3;
def calc_R1 =  (2 * calc_PP) - L;
def calc_R2 = calc_PP + H - L;
def calc_R3 = H + 2 * (calc_PP - L);

def calc_S1 = (2 * calc_PP) - H;
def calc_S2 = calc_PP - H + L;
def calc_S3 = L - 2 * (H - calc_PP);

plot R3;
plot R2;
plot R1;
plot PP;
plot S1;
plot S2;
plot S3;

if (showOnlyToday and !IsNaN(close(period = timeFrame)[-1])) or
(getAggregationPeriod() > if timeframe == timeframe.WEEK then AggregationPeriod.WEEK else AggregationPeriod.MONTH)

then {

    R1 = Double.NaN;

    R2 = Double.NaN;

    R3 = Double.NaN;

    PP = Double.NaN;

    S1 = Double.NaN;

    S2 = Double.NaN;

    S3 = Double.NaN;

}
else {


R1 = calc_R1;

    R2 = calc_R2;

    R3 = calc_R3;

    PP = calc_PP;

    S1 = calc_S1;

    S2 = calc_S2;

    S3 = calc_S3;

}

R1.SetDefaultColor(color.red);
R2.SetDefaultColor(color.red);
R3.SetDefaultColor(color.red);
S1.SetDefaultColor(color.green);
S2.SetDefaultColor(color.green);
S3.SetDefaultColor(color.green);

R1.SetStyle(Curve.POINTS);R2.SetStyle(Curve.POINTS);
R3.SetStyle(Curve.POINTS);
S1.SetStyle(Curve.POINTS);
S2.SetStyle(Curve.POINTS);
S3.SetStyle(Curve.POINTS);

PP.DefineColor("Color", Color.CYAN);
PP.AssignValueColor(PP.color("Color"));
PP.SetPaintingStrategy(PaintingStrategy.HORIZONTAL);
Shareable Link
https://tos.mx/xRWpT3Attachments
Last edited by a moderator:
") I would suggest a longer time period than 1 day...perhaps 10 or 20 days...
I would suggest a longer time period than 1 day...perhaps 10 or 20 days...