
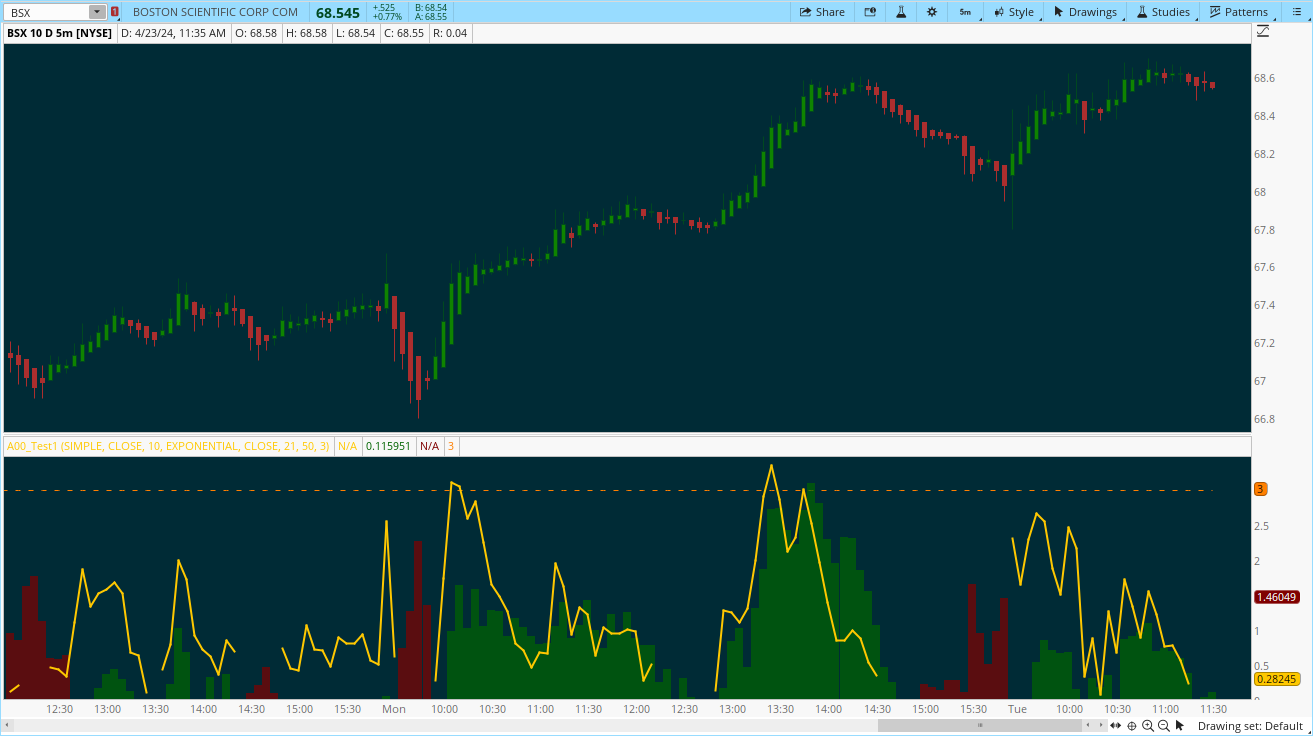
Webby's RSI (Really Simple Indicator) 2.0 or version 5.150 as Mike himself calls it, builds upon the original Webby RSI by changing the way we measure extension from the 21-day exponential moving average.
Instead using the percentage of the low versus the 21-day exponential moving average, version 2 uses a multiple of the securities 50 day ATR (average true range) to determine the extension.
Version 2.0 also comes with some new additions, such as measuring the high vs 21-day exponential moving average when a security is below it, as well as an ATR extension from the 10-day simple moving average that Mike looks to as a guide to take partials.
Here is an open source script of Webbys_RSI Ver 2, or version 5 as Webby calls it, for TradingView by AmphibianTrading.com. If possible could someone allot better at coding v me please turn this into a TOS study / indicator? Here's a link to the website mentioned:
https://www.tradingview.com/script/atuLQ8ZN-Webby-s-RSI-2-0/
Very Much Appreciated!!!
Last edited by a moderator: