WaveTrend Oscillator for ThinkorSwim [LazyBear]

BenTen

Administrative
Staff member
Staff
VIP
Lifetime
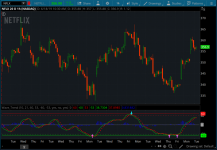
Here's the WaveTrend Oscillator script for ThinkorSwim. Came LazyBear over at TradingView version that was ported from TS/MT, also known as "The Perfect Leading Indicator."

According to the Forex indicator:

It features a sophisticated algorithm which enables it to detect true reversals in a extremely accurate manner. The beauty of this indicator is that is does not generate signals during choppy sideways markets.

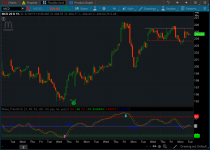
A Buy signal is generated based on the oscillator crosses above the signal while below the Oversold band. You'll see a Sell signal when the oscillator is above the overbought band and crosses down on the signal line.

I'm also happy to say that the WaveTrend signals does not repaint.

LkL1CI7.png


IORymcb.png


thinkScript Code

Rich (BB code):
#WaveTrend Oscillator script for ThinkorSwim. Came from Came LazyBear over at TradingView version that was ported from TS/MT
# also known as "The Perfect Leading Indicator."
#ported by BenTen 6/18/19
#WT_LB Short Name TV
declare lower;
input Channel_Length = 10; #10
input Average_Length = 21; #10
input over_bought_1 = 60;
input over_bought_2 = 53;
input over_sold_1 = -60;
input over_sold_2 = -53;
input show_bubbles = yes;
input show_sec_bbls = no;
input show_alerts = yes;
def ap = hlc3;
def esa = ExpAverage(ap, Channel_Length);
def d = ExpAverage(AbsValue(ap - esa), Channel_Length);
def ci = (ap - esa) / (0.015 * d);
def tci = ExpAverage(ci, Average_Length);
def wt1 = tci;
def wt2 = SimpleMovingAvg(wt1, 4);
#def zero = 0;
plot zero = 0;
zero.SetDefaultColor( Color.GRAY );
plot obLevel1 = over_bought_1;
obLevel1.SetDefaultColor(Color.RED);
plot osLevel1 = over_sold_1;
osLevel1.SetDefaultColor(Color.GREEN);
plot  obLevel2 = over_bought_2;
obLevel2.SetDefaultColor(Color.RED);
obLevel2.SetStyle(Curve.SHORT_DASH);
plot  osLevel2 = over_sold_2;
osLevel2.SetDefaultColor(Color.GREEN);
osLevel2.SetStyle(Curve.SHORT_DASH);

plot wt1_1 = wt1;
wt1_1.SetDefaultColor(Color.GREEN);
plot wt2_1 = wt2;
wt2_1.SetDefaultColor(Color.RED);
wt2_1.SetStyle(Curve.POINTS);
plot wt3 = (wt1 - wt2);
wt3.SetDefaultColor(Color.BLUE);
wt3.SetPaintingStrategy(PaintingStrategy.HISTOGRAM);
def signal1 = wt1 crosses above wt2 and wt1 < over_sold_2;
plot Signal = if signal1  then (signal1 * over_sold_2) else Double.NaN;
Signal.SetDefaultColor(Color.GREEN);
Signal.SetPaintingStrategy(PaintingStrategy.ARROW_UP);
Signal.SetLineWeight(3);
Signal.HideTitle();
def signal2 = wt1 crosses below wt2 and wt1 > over_bought_2;
plot Signal2_ = if signal2  then (signal2 * over_bought_2) else Double.NaN;
Signal2_.SetDefaultColor(Color.RED);
Signal2_.SetPaintingStrategy(PaintingStrategy.ARROW_DOWN);
Signal2_.SetLineWeight(3);
Signal2_.HideTitle();

Shareable Link

Credits:
 

Attachments

  • LkL1CI7.png
    LkL1CI7.png
    364.5 KB · Views: 533
  • IORymcb.png
    IORymcb.png
    333.2 KB · Views: 431
Last edited by a moderator:

Join useThinkScript to post your question to a community of 21,000+ developers and traders.

WaveTrend indicator with Ichimoku.

Code:
# MOHFWaveTrendIchimoku
# @myownhedgefund
# Last updated: 4/11/2018
# Modified from LazyBear's Pine script port
#   https://www.tradingview.com/u/LazyBear/
# Modified from ducksjc's Pine script port 
#   https://www.tradingview.com/u/ducksjc/
# Modified from TD Ameritrade's Ichimoku 
# 
#   www.myownhedgefund.com
#

declare lower;

#Ichimoku Input
input len = 10;
input tenkan_period = 9;
input kijun_period = 26;

#WT
def ap = hlc3;
def esa = ExpAverage(ap, len);
def d = ExpAverage(AbsValue(ap - esa), len);
def ci = (ap - esa) / (0.015 * d);
def tci = ExpAverage(ci, 21);
#def wt1 = Round(tci, 1);
def wt1 = tci;
def wt2 = Average(wt1, 4);

#Ichimoku
#def Tenkan = (Highest(high, tenkan_period) + Lowest(low, tenkan_period)) / 2;
#def Kijun = (Highest(high, kijun_period) + Lowest(low, kijun_period)) / 2;
#def "Span A" = (Tenkan[kijun_period] + Kijun[kijun_period]) / 2;
#def "Span B" = (Highest(high[kijun_period], 2 * kijun_period) + Lowest(low[kijun_period], 2 * kijun_period)) / 2;
#def Chikou = close[-kijun_period];
#DefineGlobalColor("Neutral", Color.GRAY);
#DefineGlobalColor("Bullish", Color.GREEN);
#DefineGlobalColor("Bearish", Color.RED);
#AddCloud("Span A", "Span B", globalColor("Bullish"), globalColor("Bearish"));

#WT+Ichimoku
def turn = (Lowest(wt1, tenkan_period) + Highest(wt1, tenkan_period)) / 2;
def std = (Lowest(wt1, kijun_period) + Highest(wt1, kijun_period)) / 2;

plot WT = wt1;
WT.SetStyle(curve.Points);
WT.SetDefaultColor(Color.GRAY);

WT.AssignValueColor( if wt1>turn and wt1>std then (Color.GREEN)
else if wt1<std and wt1<turn then (Color.RED) else (color.GRAY));

plot WTTurn = turn;
plot WTstd = std;
WTTurn.SetDefaultColor(Color.BLUE);
WTstd.SetDefaultColor(Color.RED);

#WT
#plot WT_Fast = wt1;
#plot WT_Slow = wt2;
#plot WT_Diff = wt1 - wt2;
plot Zero = 0;
plot OS1 = -60;
plot OS2 = -53;
plot OB1 = 60;
plot OB2 = 53;

#WT_Fast.SetDefaultColor(Color.CYAN);
#WT_Slow.SetDefaultColor(Color.RED);
#WT_Diff.SetDefaultColor(Color.GRAY);
Zero.SetDefaultColor(Color.GRAY);
OS1.SetDefaultColor(Color.GREEN);
OS2.SetDefaultColor(Color.GREEN);
OB1.SetDefaultColor(Color.RED);
OB2.SetDefaultColor(Color.RED);
# End Script
 
Last edited:
@BenTen hi. would this indicator be useful on daily charts? i am thinking of using it with a slowRSI to indicate overbought and oversold and therefore reversals. what do you think?

 
Last edited:
@cherif That would be interesting to check and backtest. I have not been able to go through this indicator for long so I definitely don't have any personal experience with it yet.

 
Last edited:
Redundant to TMO. Same calculations. Just use TMO and it already has the MTF. Why waste time on a second study or is it the arrows that are attractive?
 
Seems this is pretty much identical to PPO/MACD. Its a momentum based indicator using differences of different averages length
 
not just the upper arrows but the lower study with its matching arrows too not showing very well actually..... to go with showing the false signals
All you do is take off all the plots except for the last two then move the indicator to the price box.
 
All you do is take off all the plots except for the last two then move the indicator to the price box.
I was just commenting about how the lower actual study when watching it was not doing well and showing the false signals so watching the upper study arrows without watching the whole study is like flying blind for a while at least with this study which I do not know very well yet or if ever ..that is all thanks for the info
 
I was just commenting about how the lower actual study when watching it was not doing well and showing the false signals so watching the upper study arrows without watching the whole study is like flying blind for a while at least with this study which I do not know very well yet or if ever ..that is all thanks for the info

I will share an approach on how to trade this when I get back from my travels. it's actually pretty good for intra day trading.
 
The Wave Trend Oscillator is a great tool. Is there a scan to identify when the Wt2_1 red dot first goes under the Wt1_1 line?
 
Last edited by a moderator:
I have been using the following as an upper study and turning off everything but the arrows. The spacing is a little wonky though, obviously because it is a lower study. Can someone help get this as an upper study that only shows the arrows please? It will save space on my charts and others using Blake Mathis's setup.

Thanks!
 
Last edited by a moderator:

Similar threads

Not the exact question you're looking for?

Start a new thread and receive assistance from our community.

87k+ Posts
293 Online
Create Post

Similar threads

Similar threads

The Market Trading Game Changer

Join 2,500+ subscribers inside the useThinkScript VIP Membership Club
  • Exclusive indicators
  • Proven strategies & setups
  • Private Discord community
  • ‘Buy The Dip’ signal alerts
  • Exclusive members-only content
  • Add-ons and resources
  • 1 full year of unlimited support

Frequently Asked Questions

What is useThinkScript?

useThinkScript is the #1 community of stock market investors using indicators and other tools to power their trading strategies. Traders of all skill levels use our forums to learn about scripting and indicators, help each other, and discover new ways to gain an edge in the markets.

How do I get started?

We get it. Our forum can be intimidating, if not overwhelming. With thousands of topics, tens of thousands of posts, our community has created an incredibly deep knowledge base for stock traders. No one can ever exhaust every resource provided on our site.

If you are new, or just looking for guidance, here are some helpful links to get you started.

What are the benefits of VIP Membership?
VIP members get exclusive access to these proven and tested premium indicators: Buy the Dip, Advanced Market Moves 2.0, Take Profit, and Volatility Trading Range. In addition, VIP members get access to over 50 VIP-only custom indicators, add-ons, and strategies, private VIP-only forums, private Discord channel to discuss trades and strategies in real-time, customer support, trade alerts, and much more. Learn all about VIP membership here.
How can I access the premium indicators?
To access the premium indicators, which are plug and play ready, sign up for VIP membership here.
Back
Top