greghoverstreet
New member
I am looking for a thinkscript that can show me highlighted the last hour of trading the previous day on my current day 5 minute chart. thank you
I am looking for a thinkscript that can show me highlighted the last hour of trading the previous day on my current day 5 minute chart. thank you
#prev_day_period_levels_00

#https://usethinkscript.com/threads/want-the-range-of-the-previous-days-last-hour.16393/
#Want the range of the previous day's last hour

def na = Double.NaN;
def bn = BarNumber();

def gd = GetDay();
def newday = gd != gd[1];
def lastday = getlastday();

input days_ago = 1;
def curr_day = (gd == LastDay);
def target_day = ((gd + days_ago) == LastDay);
addlabel(1, days_ago + "...I am looking for a thinkscript that can show me highlighted the last hour of trading the previous day on my current day 5 minute chart. thank you
#prev_day_period_levels_00

#https://usethinkscript.com/threads/want-the-range-of-the-previous-days-last-hour.16393/
#Want the range of the previous day's last hour

def na = Double.NaN;
def bn = BarNumber();

def gd = GetDay();
def newday = gd != gd[1];
def lastday = getlastday();

input days_ago = 1;
def curr_day = (gd == LastDay);
def target_day = ((gd + days_ago) == LastDay);
addlabel(1, days_ago + " days before current", color.yellow);

def big = 99999;
input start = 1500;
input end = 1600;
def period = if secondsfromTime(start) >= 0 and secondstillTime(end) > 0 then 1 else 0;

def hix = if bn == 1 then 0
 else if period and target_day and !period[1] then high
 else if period and target_day and high > hix[1] then high
 else hix[1];

def lox = if bn == 1 then big
 else if period and target_day and !period[1] then low
 else if period and target_day and low < lox[1] then low
 else lox[1];

def last_period = if period and curr_day then 1 else 0;
def top = if last_period then hix else na;
def bot = if last_period then lox else na;
plot z3 = top;
plot z4 = bot;

# last day
input show_last_day_cloud = yes;
addcloud((if show_last_day_cloud and last_period then top else na),(if show_last_day_cloud and last_period then bot else na), color.light_gray);


input test1_hilo_lines = no;
plot zhix = if test1_hilo_lines and hix > 0 then hix else na;
plot zlox = if test1_hilo_lines and lox < big then lox else na;

input test2_bubbles = no;
addchartbubble(test2_bubbles, low*0.998,
gd + "\n" +
lastday + "\n" +
last_period + "\n" +
target_day + " Td\n" +
curr_day
, (if target_day then color.yellow else color.gray), no);
#, (if x then color.yellow else color.gray), no);
#

Sure,
awesome! I am also not seeing it day by day. Only shows later in the weekSure,
put a hashtag (#) in front of the AddLabel statement.
So I am having problems with this. it is not populating on mondays and isnt populating at open until close. I see it on like tuesday or wednesday on and it doesnt form at open. thank you!this will draw a cloud on the current day, at price levels from the min and max from a time period, on a previous day.
can pick how many days back, and start and stop times.
Code:#prev_day_period_levels_00 #https://usethinkscript.com/threads/want-the-range-of-the-previous-days-last-hour.16393/ #Want the range of the previous day's last hour def na = Double.NaN; def bn = BarNumber(); def gd = GetDay(); def newday = gd != gd[1]; def lastday = getlastday(); input days_ago = 1; def curr_day = (gd == LastDay); def target_day = ((gd + days_ago) == LastDay); addlabel(1, days_ago + " days before current", color.yellow); def big = 99999; input start = 1500; input end = 1600; def period = if secondsfromTime(start) >= 0 and secondstillTime(end) > 0 then 1 else 0; def hix = if bn == 1 then 0 else if period and target_day and !period[1] then high else if period and target_day and high > hix[1] then high else hix[1]; def lox = if bn == 1 then big else if period and target_day and !period[1] then low else if period and target_day and low < lox[1] then low else lox[1]; def last_period = if period and curr_day then 1 else 0; def top = if last_period then hix else na; def bot = if last_period then lox else na; plot z3 = top; plot z4 = bot; # last day input show_last_day_cloud = yes; addcloud((if show_last_day_cloud and last_period then top else na),(if show_last_day_cloud and last_period then bot else na), color.light_gray); input test1_hilo_lines = no; plot zhix = if test1_hilo_lines and hix > 0 then hix else na; plot zlox = if test1_hilo_lines and lox < big then lox else na; input test2_bubbles = no; addchartbubble(test2_bubbles, low*0.998, gd + "\n" + lastday + "\n" + last_period + "\n" + target_day + " Td\n" + curr_day , (if target_day then color.yellow else color.gray), no); #, (if x then color.yellow else color.gray), no); #
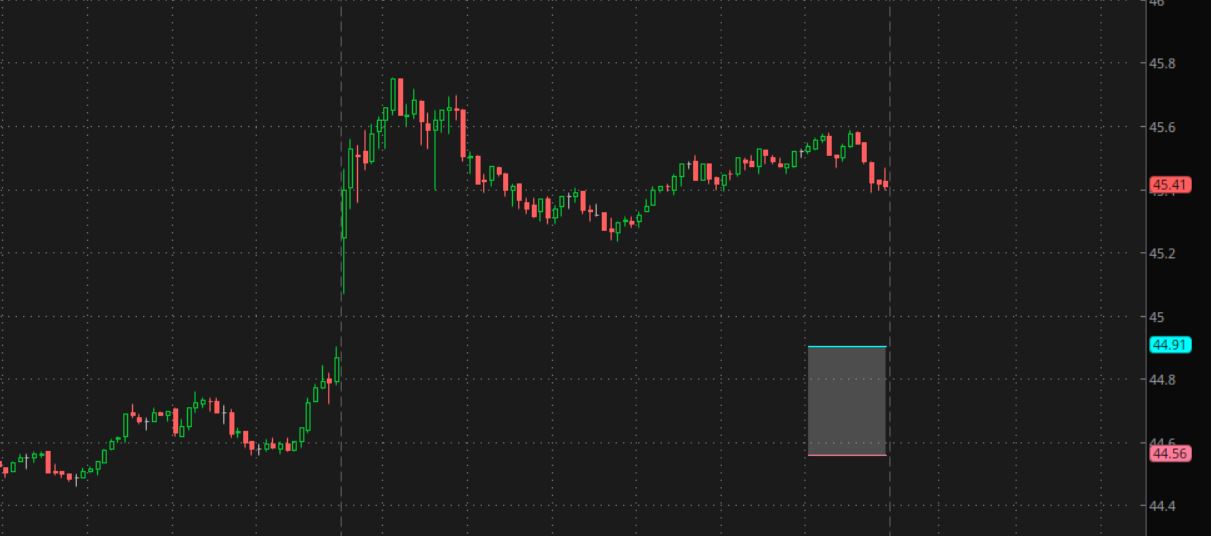
cloud on last day. price levels from period on target day
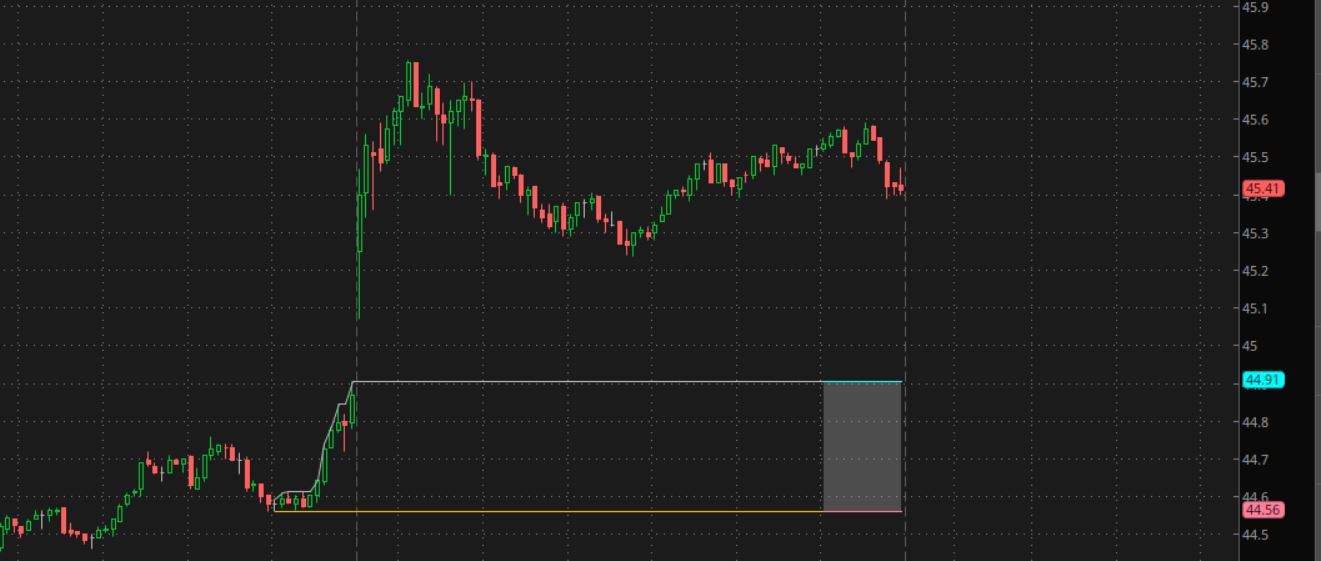
last hour of day. BK 5min

cloud and lines from target day

Join useThinkScript to post your question to a community of 21,000+ developers and traders.
| Thread starter | Similar threads | Forum | Replies | Date |
|---|---|---|---|---|
| Q | Previous High/Low Range extended to current day | Questions | 2 | |
| J | Previous candlestick range label | Questions | 2 | |
|
|
Previous day 5' candle range? | Questions | 6 | |
| S | Paint bars for break of two previous candle range | Questions | 1 | |
| P | Need Help with a "top 10% range of the 2nd previous bar indicator plottedPlease | Questions | 2 |
Start a new thread and receive assistance from our community.
useThinkScript is the #1 community of stock market investors using indicators and other tools to power their trading strategies. Traders of all skill levels use our forums to learn about scripting and indicators, help each other, and discover new ways to gain an edge in the markets.
We get it. Our forum can be intimidating, if not overwhelming. With thousands of topics, tens of thousands of posts, our community has created an incredibly deep knowledge base for stock traders. No one can ever exhaust every resource provided on our site.
If you are new, or just looking for guidance, here are some helpful links to get you started.