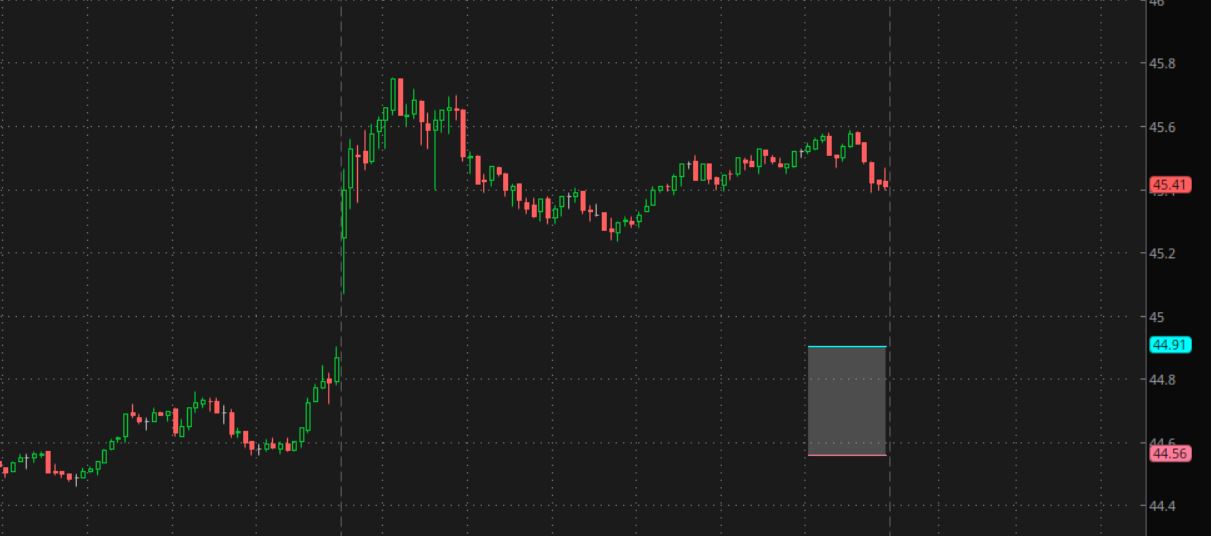
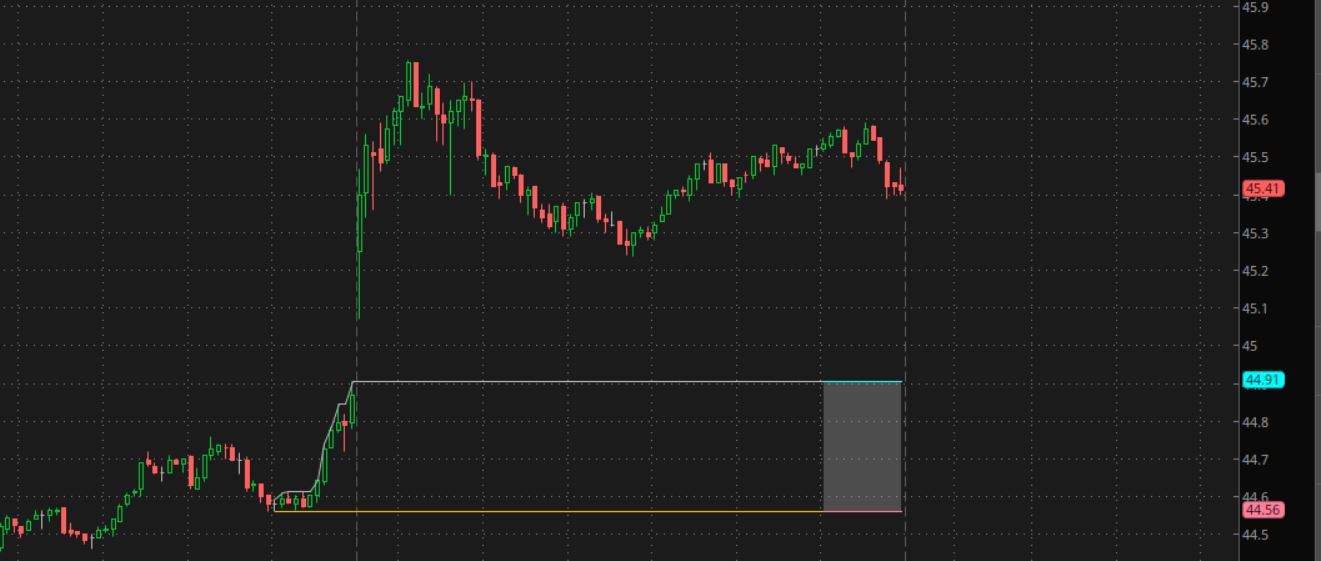
this will draw a cloud on the current day, at price levels from the min and max from a time period, on a previous day.
can pick how many days back, and start and stop times.
Code:
#prev_day_period_levels_00

#https://usethinkscript.com/threads/want-the-range-of-the-previous-days-last-hour.16393/
#Want the range of the previous day's last hour

def na = Double.NaN;
def bn = BarNumber();

def gd = GetDay();
def newday = gd != gd[1];
def lastday = getlastday();

input days_ago = 1;
def curr_day = (gd == LastDay);
def target_day = ((gd + days_ago) == LastDay);
addlabel(1, days_ago + " days before current", color.yellow);

def big = 99999;
input start = 1500;
input end = 1600;
def period = if secondsfromTime(start) >= 0 and secondstillTime(end) > 0 then 1 else 0;

def hix = if bn == 1 then 0
 else if period and target_day and !period[1] then high
 else if period and target_day and high > hix[1] then high
 else hix[1];

def lox = if bn == 1 then big
 else if period and target_day and !period[1] then low
 else if period and target_day and low < lox[1] then low
 else lox[1];

def last_period = if period and curr_day then 1 else 0;
def top = if last_period then hix else na;
def bot = if last_period then lox else na;
plot z3 = top;
plot z4 = bot;

# last day
input show_last_day_cloud = yes;
addcloud((if show_last_day_cloud and last_period then top else na),(if show_last_day_cloud and last_period then bot else na), color.light_gray);


input test1_hilo_lines = no;
plot zhix = if test1_hilo_lines and hix > 0 then hix else na;
plot zlox = if test1_hilo_lines and lox < big then lox else na;

input test2_bubbles = no;
addchartbubble(test2_bubbles, low*0.998,
gd + "\n" +
lastday + "\n" +
last_period + "\n" +
target_day + " Td\n" +
curr_day
, (if target_day then color.yellow else color.gray), no);
#, (if x then color.yellow else color.gray), no);
#
cloud on last day. price levels from period on target day
last hour of day. BK 5min
cloud and lines from target day