greghoverstreet
New member
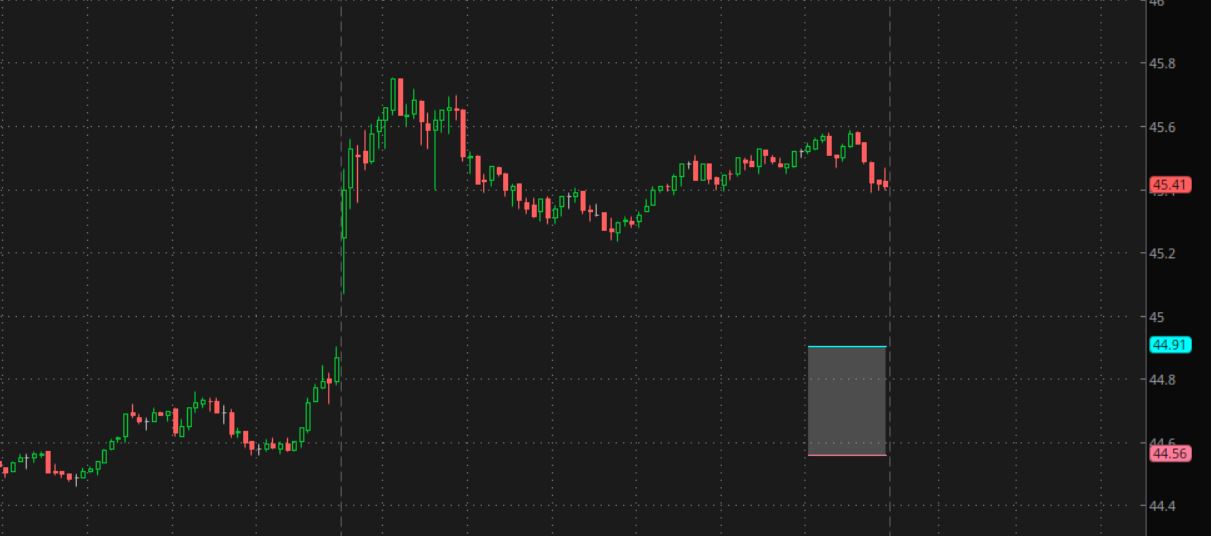
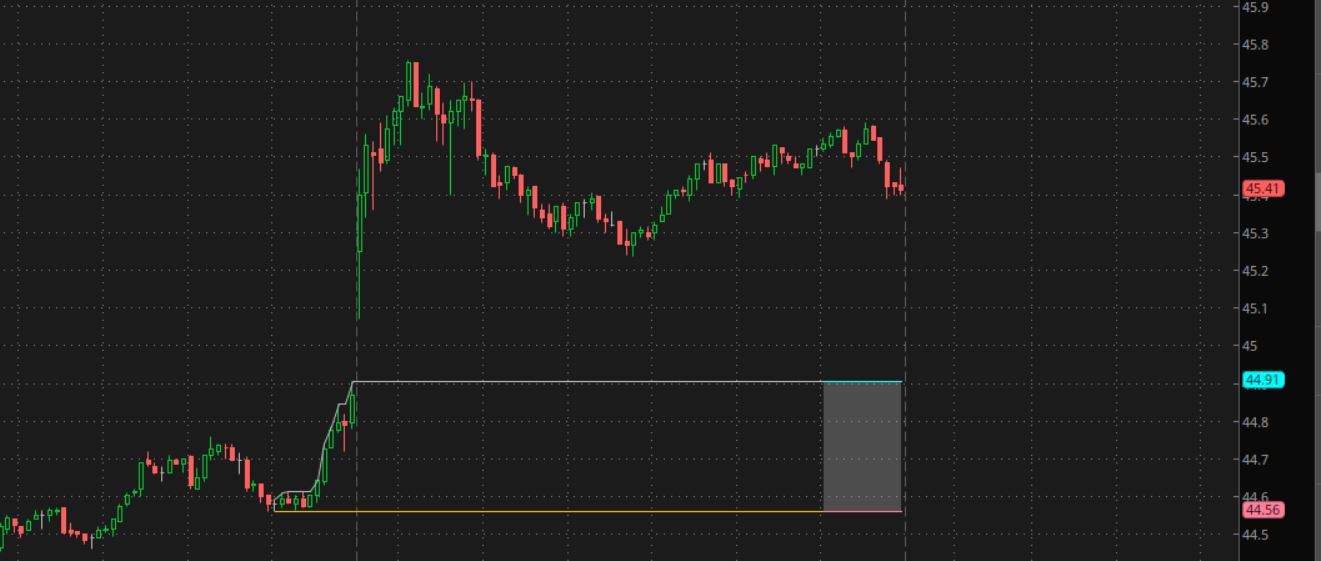
I am looking for a thinkscript that can show me highlighted the last hour of trading the previous day on my current day 5 minute chart. thank you
| Thread starter | Similar threads | Forum | Replies | Date |
|---|---|---|---|---|
| H | Need help for background shading a range from previous trading day | Questions | 4 | |
| Q | Previous High/Low Range extended to current day | Questions | 2 | |
| J | Previous candlestick range label | Questions | 2 | |
|
|
Previous day 5' candle range? | Questions | 6 | |
| S | Paint bars for break of two previous candle range | Questions | 1 |
useThinkScript is the #1 community of stock market investors using indicators and other tools to power their trading strategies. Traders of all skill levels use our forums to learn about scripting and indicators, help each other, and discover new ways to gain an edge in the markets.
We get it. Our forum can be intimidating, if not overwhelming. With thousands of topics, tens of thousands of posts, our community has created an incredibly deep knowledge base for stock traders. No one can ever exhaust every resource provided on our site.
If you are new, or just looking for guidance, here are some helpful links to get you started.