VWAP Open Session Anchored for ThinkOrSwim

samer800

Moderator - Expert
VIP
Lifetime
ZIjgvKp.png

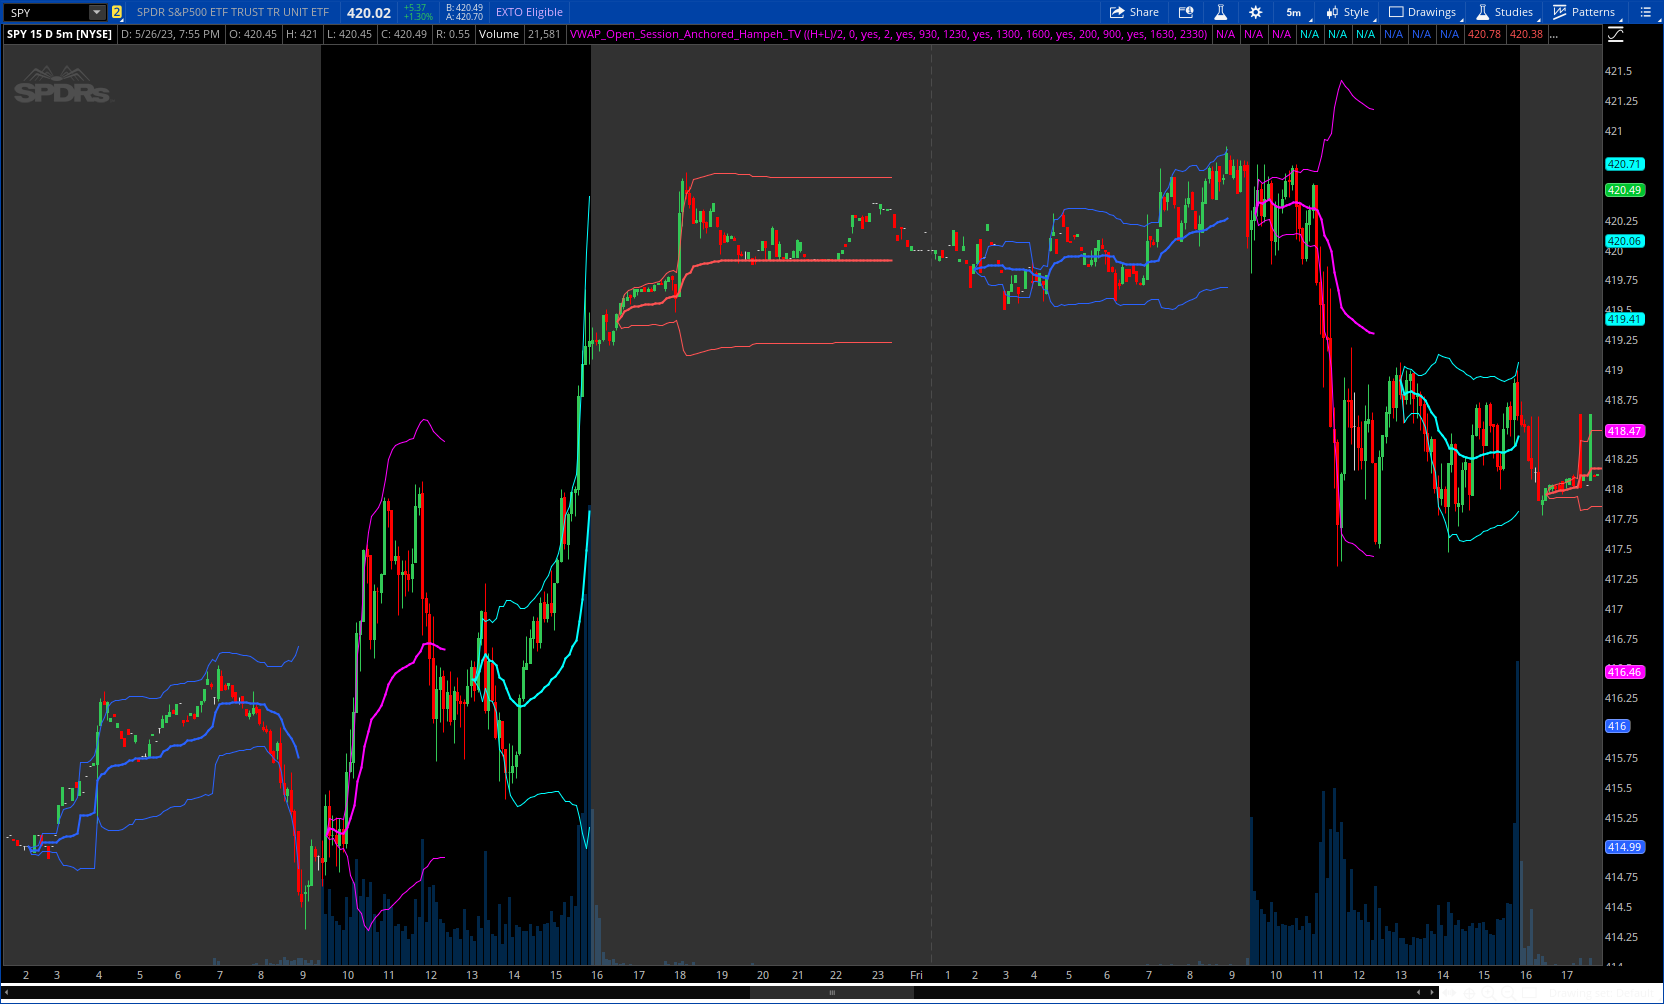
The VWAP Open Session Anchored indicator differs from traditional VWAP indicators by automatically anchoring the Volume Weighted Average Price calculation to three market session starts Morning, Evening, and Night. Each session represents a distinct time period within the trading day, offering traders and investors a more comprehensive view of the volume-weighted average price within specific sessions.

CODE:
CSS:
#// This source code is subject to the terms of the Mozilla Public License 2.0 at https://mozilla.org/MPL/2.0/
# @Hampeh
#indicator("VWAP Open Session Anchored by Hampeh", "VWAP OPen Session", true)
# Converted and mod by Sam4Cok@Samer800        - 05/2023
input source     = hl2;                # "Source"
input offset     = 0;                   # "Offset"
input showBands  = no;                  # "Band Multiplier"
input multiplier = 2;                   # "Multiplier"
input morning    = yes;
input morningSessionStartTime  = 0930;
input morningSessionEndTime    = 1230;
input evening    = yes;
input eveningSessionStartTime  = 1400;
input eveningSessionEndTime    = 1600;
input preMarket  = yes;
input preMarketStartTime  = 0200;
input preMarketEndTime    = 0900;
input afterHours = yes;
input afterHoursStartTime = 1630;
input afterHoursEndTime   = 2330;

def na = Double.NaN;
def morningSession    = SecondsTillTime(morningSessionStartTime) < 0 and SecondsTillTime(morningSessionEndTime) > 0;
def eveningSession    = SecondsTillTime(eveningSessionStartTime) < 0 and SecondsTillTime(eveningSessionEndTime) > 0;
def premarketSession  = SecondsTillTime(preMarketStartTime)  < 0 and SecondsTillTime(preMarketEndTime) > 0;
def afterHoursSession = SecondsTillTime(afterHoursStartTime) < 0 and SecondsTillTime(afterHoursEndTime) > 0;

#--- Color
DefineGlobalColor("morining"   , Color.MAGENTA);
DefineGlobalColor("evening"    , Color.CYAN);
DefineGlobalColor("premarket"  , CreateColor(41,98,255));
DefineGlobalColor("afterHours" , CreateColor(255,82,82));
#export f_Vwap(simple string tf, float src, float src_v) =>
script f_Vwap {
    input src = close;
    input tf = close;
    input multiplier = 1;
    def src_v = volume;
    def start0 = tf - tf[1];
    def sumSrc0 = src * src_v;
    def sumVol0 = src_v;
    def sumSrc2 = src_v * Sqr(src);
    def sumSrc1 = CompoundValue(1, if start0 then sumSrc0 else sumSrc0 + sumSrc1[1], sumSrc0);
    def sumVol1 = CompoundValue(1, if start0 then sumVol0 else sumVol0 + sumVol1[1], sumVol0);
    def sumVol2 = CompoundValue(1, if start0 then sumSrc2 else sumSrc2 + sumVol2[1], sumSrc2);
    def Vwap = sumSrc1 / sumVol1;
    def deviation = Sqrt(Max(sumVol2 / sumVol1 - Sqr(Vwap), 0));
    plot wap = Vwap;
    plot Upper = Vwap + deviation * multiplier;
    plot Lower = Vwap - deviation * multiplier;
}
def morningVwap  = f_Vwap(source, morningSession, multiplier).wap;
def morningUpper = f_Vwap(source, morningSession, multiplier).Upper;
def morningLower = f_Vwap(source, morningSession, multiplier).Lower;

def eveningVwap  = f_Vwap(source, eveningSession, multiplier).wap;
def eveningUpper = f_Vwap(source, eveningSession, multiplier).Upper;
def eveningLower = f_Vwap(source, eveningSession, multiplier).Lower;

def premarketVwap  = f_Vwap(source, premarketSession, multiplier).wap;
def premarketUpper = f_Vwap(source, premarketSession, multiplier).Upper;
def premarketLower = f_Vwap(source, premarketSession, multiplier).Lower;

def nightVwap  = f_Vwap(source, afterHoursSession, multiplier).wap;
def nightUpper = f_Vwap(source, afterHoursSession, multiplier).Upper;
def nightLower = f_Vwap(source, afterHoursSession, multiplier).Lower;

#// PLOTS
plot plotMorningUpper = if morning and showBands and morningSession then morningUpper[offset] else na;
plotMorningUpper.SetDefaultColor(GlobalColor("morining"));
plot plotMorningVwap  = if morning and morningSession then morningVwap[offset] else na;
plotMorningVwap.SetDefaultColor(GlobalColor("morining"));
plotMorningVwap.SetLineWeight(2);
plot plotMorningLower = if morning and showBands and morningSession then morningLower[offset] else na;
plotMorningLower.SetDefaultColor(GlobalColor("morining"));

plot plotEveningUpper  = if evening and showBands and eveningSession then eveningUpper[offset] else na;
plotEveningUpper.SetDefaultColor(GlobalColor("evening"));
plot plotEveningVwap   = if evening and eveningSession then eveningVwap[offset] else na;
plotEveningVwap.SetDefaultColor(GlobalColor("evening"));
plotEveningVwap.SetLineWeight(2);
plot plotEveningLower  = if evening and showBands and eveningSession then eveningLower[offset] else na;
plotEveningLower.SetDefaultColor(GlobalColor("evening"));

plot plotPremarketUpper = if preMarket and showBands and premarketSession then premarketUpper[offset] else na;
plotPremarketUpper.SetDefaultColor(GlobalColor("premarket"));
plot plotPremarketVwap  = if preMarket and premarketSession then premarketVwap[offset] else na;
plotPremarketVwap.SetDefaultColor(GlobalColor("premarket"));
plotPremarketVwap.SetLineWeight(2);
plot plotPremarketLower = if preMarket  and showBands and premarketSession  then premarketLower[offset]  else na;
plotPremarketLower.SetDefaultColor(GlobalColor("premarket"));

plot plotAfterHoursNightUpper = if afterHours and showBands and afterHoursSession then nightUpper[offset] else na;
plotAfterHoursNightUpper.SetDefaultColor(GlobalColor("afterHours"));
plot plotAfterHoursVwap  = if afterHours and afterHoursSession then nightVwap[offset] else na;
plotAfterHoursVwap.SetDefaultColor(GlobalColor("afterHours"));
plotAfterHoursVwap.SetLineWeight(2);
plot plotAfterHoursLower = if afterHours  and showBands and afterHoursSession  then nightLower[offset]  else na;
plotAfterHoursLower.SetDefaultColor(GlobalColor("afterHours"));


#-- END of Code
 

Join useThinkScript to post your question to a community of 21,000+ developers and traders.

Hi, is there any reason why premarket session stop at 9:00am and similarly morning session ends at 12:30 instead of going all the way to 14:29, where the next session starts?
I see is common among similar anchored vwap.
I understand that I can just extend the session to my liking, but I was wondering if that was something I should do.
Thank you.
 
Is there anyway to reset VWAP at day open automatically? I know i can choose to show day trading session only, but i do wanna keep extended hours on, and only watch VWAP calculating from 9:30 only
 
Is there anyway to reset VWAP at day open automatically? I know i can choose to show day trading session only, but i do wanna keep extended hours on, and only watch VWAP calculating from 9:30 only

See if this does what you wanted

Capture.jpg
Code:
input begin = 0930;
input end   = 1600;
input numDevDn = -2.0;
input numDevUp = 2.0;
def rth = SecondsFromTime(begin) >= 0 and SecondsTillTime(end) >= 0;
def volumeSum = if rth then CompoundValue(1, volumeSum[1] + volume, volume) else 0;
def volumeVwapSum = if rth then CompoundValue(1, volumeVwapSum[1] + volume * vwap, volume * vwap) else 0;
def volumeVwap2Sum = if rth then CompoundValue(1, volumeVwap2Sum[1] + volume * Sqr(vwap), volume * Sqr(vwap)) else 0;
def price = volumeVwapSum / volumeSum;
def deviation = Sqrt(Max(volumeVwap2Sum / volumeSum - Sqr(price), 0));

plot VWAP = price;
plot UpperBand = price + numDevUp * deviation;
plot LowerBand = price + numDevDn * deviation;

VWAP.SetDefaultColor(GetColor(0));
UpperBand.SetDefaultColor(GetColor(2));
LowerBand.SetDefaultColor(GetColor(4));
 
I got this off this site, I use it for my day trading. Anchored VWAP.

#yakBro intraday anchoredVWAP excluding extended hours volume 2019

declare hide_on_daily;

def anchorTime = 0930;
def anchorEnd = 1600;

input ShowTodayOnly = yes;
def Today = if GetDay() == GetLastDay() then 1 else 0;
def postAnchorTime = if SecondsFromTime(anchorTime) >= 0 then 1 else 0;
def endAchorTime = if SecondsTillTime(anchorEnd) >= 0 then 1 else 0;

#plot anchorVWAP for intraday
def volumeSum = compoundValue(1, if postAnchorTime and endAchorTime then volumeSum[1] + volume else 0, volume);
def volumeVwapSum = compoundValue(1, if postAnchorTime and endAchorTime then volumeVwapSum[1] + volume * vwap else 0, volume * vwap);

plot anchorVWAP = if ShowTodayOnly and !Today then Double.NaN else if anchorTime then volumeVwapSum / volumeSum else Double.NaN;
anchorVWAP.setStyle(Curve.Firm);
anchorVWAP.setDefaultColor(Color.light_ORANGE);
anchorVWAP.setlineWeight(2);
 
I tried to anchor VWAP at another time, let's say starting from yesterday close to today close. I tried to adjust the input to 1600 to 1559 but nothing appeared, anyone knows how to do it?
 
I tried to anchor VWAP at another time, let's say starting from yesterday close to today close. I tried to adjust the input to 1600 to 1559 but nothing appeared, anyone knows how to do it?

See if this does what you wanted. The anchor of VWAP is dependent on how the following is defined in the code
def periodIndx = if GetTime() crosses above RegularTradingEnd(GetYYYYMMDD()[1]) then 1 else 0;]

Here is the entire code

Capture.jpg
Ruby:
#
# TD Ameritrade IP Company, Inc. (c) 2011-2022
#
#Modified to anchor start of VWAP to close of RegularTradingEnd to RegularTradingEnd

input numDevDn = -2.0;
input numDevUp = 2.0;


def periodIndx = if GetTime() crosses above RegularTradingEnd(GetYYYYMMDD()[1]) then 1 else 0;

def isPeriodRolled = CompoundValue(1, periodIndx != periodIndx[1], yes);

def volumeSum;
def volumeVwapSum;
def volumeVwap2Sum;

if (isPeriodRolled) {
    volumeSum = volume;
    volumeVwapSum = volume * vwap;
    volumeVwap2Sum = volume * Sqr(vwap);
} else {
    volumeSum = CompoundValue(1, volumeSum[1] + volume, volume);
    volumeVwapSum = CompoundValue(1, volumeVwapSum[1] + volume * vwap, volume * vwap);
    volumeVwap2Sum = CompoundValue(1, volumeVwap2Sum[1] + volume * Sqr(vwap), volume * Sqr(vwap));
}
def price = volumeVwapSum / volumeSum;
def deviation = Sqrt(Max(volumeVwap2Sum / volumeSum - Sqr(price), 0));

plot VWAP = price;
plot UpperBand = price + numDevUp * deviation;
plot LowerBand = price + numDevDn * deviation;

VWAP.SetDefaultColor(GetColor(0));
UpperBand.SetDefaultColor(GetColor(2));
LowerBand.SetDefaultColor(GetColor(4));
 
Hi, I like to use this VWAP script with futures - it starts at regular mkt hours rather than futures open. Works well but every day I have to change the input to the correct date. How can I change this so that it will automatically adjust to today's date each day?

I tried deleting line 1 and changing it to def anchorDate = getYYYYMMDD(); and some other things I researched for hours but I **** at programming and everything I do makes the script stop working.

I'd appreciate any help!!


Code:
input anchorDate = 20230728;

input anchorTime = 930;


def postAnchorDate = if GetYYYYMMDD() >= anchorDate then 1 else 0;

def postAnchorTime = if SecondsTillTime(anchorTime) == 0 then 1 else if GetYYYYMMDD() < AnchorDate then 0 else postAnchorTime[1];


plot anchoredVWAP = TotalSum(if postAnchorDate and postAnchorTime then ((high+low+close)/3)*(volume) else 0)/TotalSum(if postAnchorDate and postAnchorTime then volume else 0);


anchoredVWAP.setStyle(Curve.Firm);

anchoredVWAP.SetLineWeight(3);

anchoredVWAP.SetDefaultColor(Color.Cyan);


#AddChartBubble(yes,close, revisedDate, color.yellow);

This code should plot a new vwap at the beginning time for futures each day and extend it to last active candle. There are 6 days currently in the code and you can choose at the input display to determine the number to show on your chart.

You can also get the vwap anchored to each day's future open using the standard TOS vwap set to DAY. However, it will only plot the vwap for that day's vwap and not extend it to the right as does the code below.

Screenshot 2023-08-13 140814.png
Code:
#need VWAP start at futures open

script v {
    input lookback = 1;
    def ymd      = GetYYYYMMDD();
    def dayCount = CompoundValue(1, if ymd != ymd[1] then dayCount[1] + 1 else dayCount[1], 0);
    def thisDay  = (HighestAll(dayCount) - dayCount) ;
    def anchor   =  lookback ;
    def volumeSum      = if thisDay <= anchor
                         then CompoundValue(1, volumeSum[1] + volume, volume)
                         else 0;
    def volumeVwapSum  = if thisDay <= anchor
                         then CompoundValue(1, volumeVwapSum[1] + volume * vwap, volume * vwap)
                         else 0;
    def volumeVwap2Sum = if thisDay <= anchor
                         then CompoundValue(1, volumeVwap2Sum[1] + volume * Sqr(vwap),
                                               volume * Sqr(vwap))
                         else 0;
    def price     = volumeVwapSum / volumeSum;
    def deviation = Sqrt(Max(volumeVwap2Sum / volumeSum - Sqr(price), 0));
    plot VWAP     = price;
}
#Day Separator
input show_day_separator = yes;
AddVerticalLine(show_day_separator and SecondsFromTime(0930) == 0, "", Color.BLUE, stroke = Curve.FIRM);

input display = 3;
plot v1 = if display < 1 then Double.NaN else v(1);
plot v2 = if display < 2 then Double.NaN else v(2);
plot v3 = if display < 3 then Double.NaN else v(3);
plot v4 = if display < 4 then Double.NaN else v(4);
plot v5 = if display < 5 then Double.NaN else v(5);
plot v6 = if display < 6 then Double.NaN else v(6);
v1.SetDefaultColor(Color.CYAN);
v2.SetDefaultColor(Color.GREEN);
v3.SetDefaultColor(Color.RED);
v1.SetLineWeight(3);
v2.SetLineWeight(3);
v3.SetLineWeight(3);
v1.SetStyle(Curve.FIRM);
v2.SetStyle(Curve.MEDIUM_DASH);
v3.SetStyle(Curve.LONG_DASH);
v4.SetDefaultColor(Color.CYAN);
v5.SetDefaultColor(Color.GREEN);
v6.SetDefaultColor(Color.RED);
v4.SetLineWeight(3);
v5.SetLineWeight(3);
v6.SetLineWeight(3);
v4.SetStyle(Curve.FIRM);
v5.SetStyle(Curve.MEDIUM_DASH);
v6.SetStyle(Curve.LONG_DASH);
 
Can this be modified to automatically anchor to the 6pm Eastern time plot?

So for example it's anchored to Monday at 6pm for the session over night and into the Tuesday RTH close
Then begins again at the Tuesday 6pm plot for over night and Wednesday session

Basically like an anchor to 9:30am open but instead it's the previous calendar day at 6pm

See if this helps

Screenshot 2023-11-01 090418.png
Code:
def anchor   =  SecondsFromTime(1800);
def volumeSum      = if anchor
                         then CompoundValue(1, volumeSum[1] + volume, volume)
                         else 0;
def volumeVwapSum  = if anchor
                         then CompoundValue(1, volumeVwapSum[1] + volume * vwap, volume * vwap)
                         else 0;
def volumeVwap2Sum = if anchor
                         then CompoundValue(1, volumeVwap2Sum[1] + volume * Sqr(vwap),
                                               volume * Sqr(vwap))
                         else 0;
def price     = volumeVwapSum / volumeSum;
def deviation = Sqrt(Max(volumeVwap2Sum / volumeSum - Sqr(price), 0));
plot VWAP     = price;

#
 

Similar threads

Not the exact question you're looking for?

Start a new thread and receive assistance from our community.

87k+ Posts
537 Online
Create Post

Similar threads

Similar threads

The Market Trading Game Changer

Join 2,500+ subscribers inside the useThinkScript VIP Membership Club
  • Exclusive indicators
  • Proven strategies & setups
  • Private Discord community
  • ‘Buy The Dip’ signal alerts
  • Exclusive members-only content
  • Add-ons and resources
  • 1 full year of unlimited support

Frequently Asked Questions

What is useThinkScript?

useThinkScript is the #1 community of stock market investors using indicators and other tools to power their trading strategies. Traders of all skill levels use our forums to learn about scripting and indicators, help each other, and discover new ways to gain an edge in the markets.

How do I get started?

We get it. Our forum can be intimidating, if not overwhelming. With thousands of topics, tens of thousands of posts, our community has created an incredibly deep knowledge base for stock traders. No one can ever exhaust every resource provided on our site.

If you are new, or just looking for guidance, here are some helpful links to get you started.

What are the benefits of VIP Membership?
VIP members get exclusive access to these proven and tested premium indicators: Buy the Dip, Advanced Market Moves 2.0, Take Profit, and Volatility Trading Range. In addition, VIP members get access to over 50 VIP-only custom indicators, add-ons, and strategies, private VIP-only forums, private Discord channel to discuss trades and strategies in real-time, customer support, trade alerts, and much more. Learn all about VIP membership here.
How can I access the premium indicators?
To access the premium indicators, which are plug and play ready, sign up for VIP membership here.
Back
Top