
Divergence trading involves identifying disparities between a stock's price and the indicator.
To predict trend reversals or continuations.
Author Message
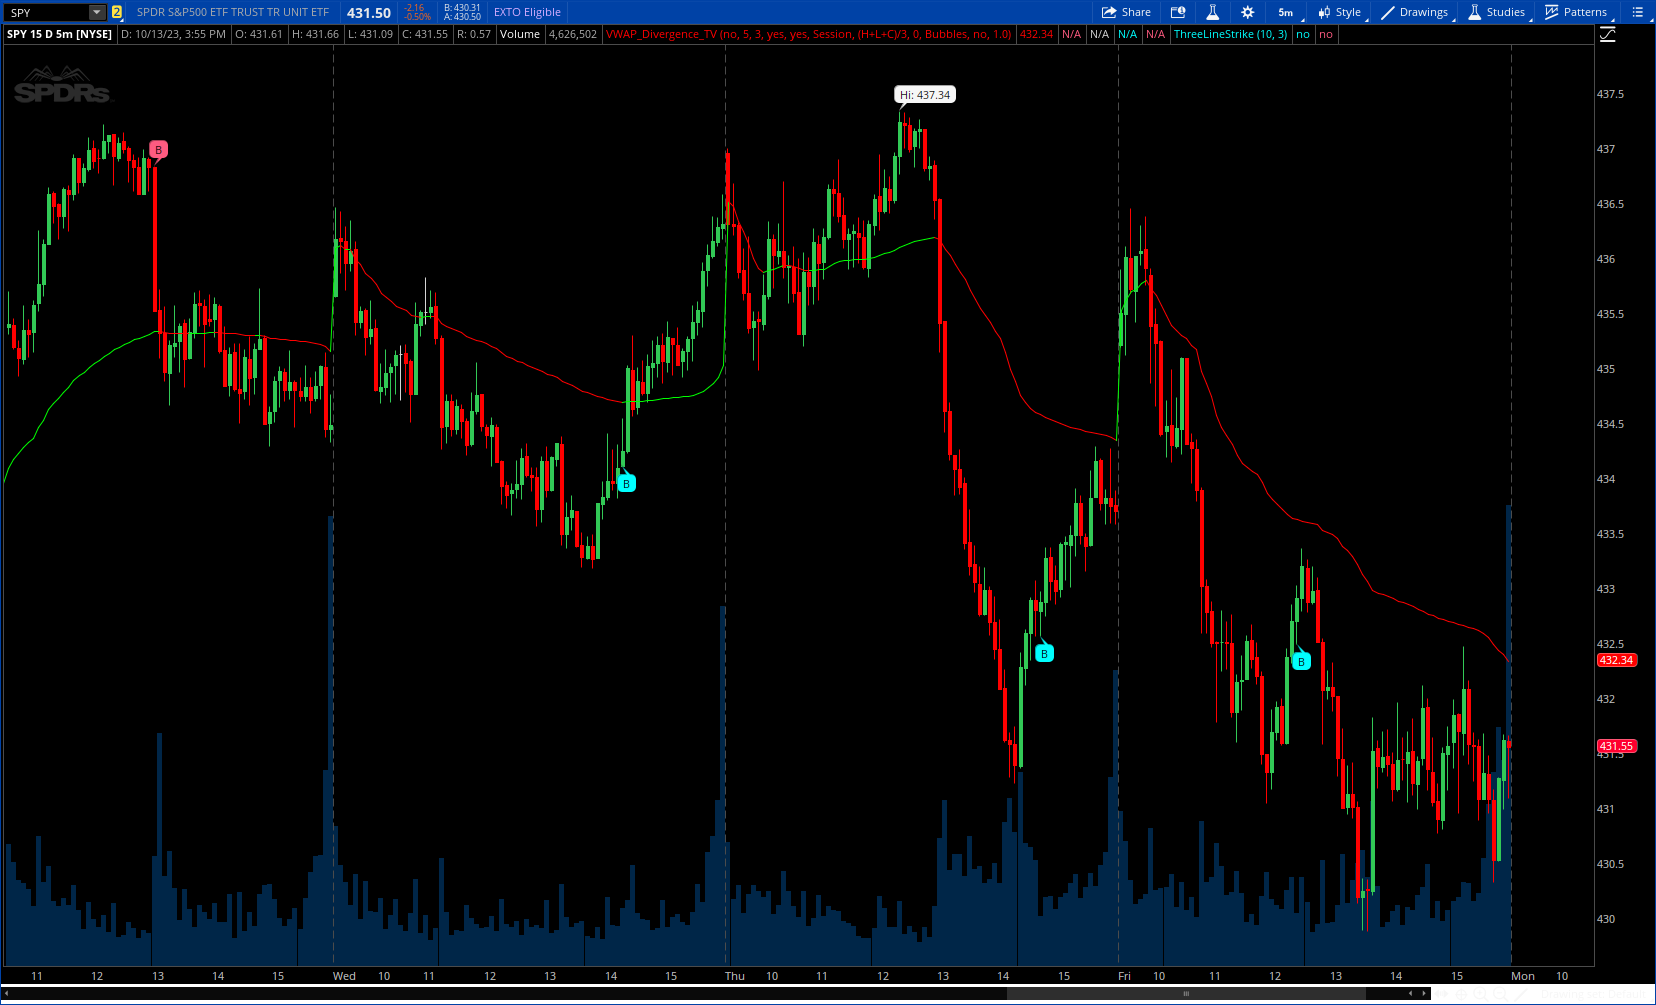
The VWAP Divergence indicator aims to find divergences between price action and the VWAP indicator. It uses filters to filter out many of the false divergences and alert high quality, accurate signals.
Cyan Bubble == Bullish divergence indicating a potential upward trend.
Magenta Bubble == Bearish divergence is the opposite, indicating a potential downtrend.
CODE:
CSS:
# https://www.tradingview.com/v/bcLxWaDF/
#// This source code is subject to the terms of the Mozilla Public License
#// © fluxchart
#indicator(title="VWAP Divergence | Flux Charts", shorttitle="VWAP Divergence | Flux Charts", overlay=true)
# Converted by Sam4Cok@Samer800    - 10/2023

input HideVwapOnDailyOrAbove = no;    # "Hide VWAP on 1D or Above"
input divergenceLookback = 5;         # "Lookback Period"
input divergenceAtrMultiplier = 3;    # "ATR Multiplier"
input alternateColor = yes;           # "Trend Coloring"
input showVWAP = yes;                 # "Show VWAP"
input anchorPeriod = {default "Session", "Week", "Month", "Quarter", "Year", "Decade", "Century", "Earnings", "Dividends", "Splits"};
input Source = hlc3;                  # "Source"
input offset = 0;                     # "Offset"
input signalStyle = {"Wedges",Default "Bubbles", "Don't Show Signals"};
input showStdvBand = no;     # "Show Standard Deviation Bands"
input stdevMult    = 1.0;    # "Bands Multiplier"

def na = Double.NaN;
def islast = !IsNaN(close);
def hideonDWM = HideVwapOnDailyOrAbove;
def bar_index = AbsValue(BarNumber());
def Wedge = signalStyle==signalStyle."Wedges";
def bubble = signalStyle==signalStyle."Bubbles";
def lastBullishDivergence1;
def lastBearishDivergence1;
def lastBullishDivergence = if lastBullishDivergence1[1] then lastBullishDivergence1[1] else bar_index;
def lastBearishDivergence = if lastBearishDivergence1[1] then lastBearishDivergence1[1] else bar_index;

#export f_Vwap(simple string tf, float src, float src_v) =>
script f_Vwap {
    input src = close;
    input tf = close;
    input mult = 1;
    input offset = 0;
    def tr = TrueRange(high, close, low);
    def src_v = Volume;
    def start0 = tf - tf[1];
    def sumSrc0 = src * src_v;
    def sumVol0 = src_v ;
    def sumSrc2 = src_v * Sqr(src);
    def sumSrc1 = CompoundValue(1, if start0 then sumSrc0 else sumSrc0 + sumSrc1[1], sumSrc0);
    def sumVol1 = CompoundValue(1, if start0 then sumVol0 else sumVol0 + sumVol1[1], sumVol0);
    def sumVol2 = CompoundValue(1, if start0 then sumSrc2 else sumSrc2 + sumVol2[1], sumSrc2);
    def Vwap = sumSrc1 / sumVol1;
    def deviation = Sqrt(Max(sumVol2 / sumVol1 - Sqr(Vwap), 0));
    plot wap = Vwap[offset];
    plot dev = deviation[offset] * mult;
}
def new_earnings = GetActualEarnings();
def new_dividends = GetDividend();
def new_split = GetSplitDenominator();

def isNewPeriod1;
switch (anchorPeriod) {
case "Week" :
    isNewPeriod1 = GetWeek();
case "Month" :
    isNewPeriod1 = GetMonth();
case "Quarter" :
    isNewPeriod1 = GetMonth() and GetMonth() % 3 == 0;
case "Year" :
    isNewPeriod1 = GetYear();
case "Decade" :
    isNewPeriod1 = GetYear() and GetYear() % 10 == 0;
case "Century" :
    isNewPeriod1 = GetYear() and GetYear() % 100 == 0;
case "Earnings" :
    isNewPeriod1 = !IsNaN(new_earnings);
case "Dividends" :
    isNewPeriod1 = !IsNaN(new_dividends);
case "Splits" :
    isNewPeriod1 = !IsNaN(new_split);
default :
    isNewPeriod1 = GetDay();
}
def isdwm = GetAggregationPeriod() >= AggregationPeriod.DAY;
def ancEarn = anchorPeriod == anchorPeriod."Earnings";
def ancDivi = anchorPeriod == anchorPeriod."Dividends";
def ancSpli = anchorPeriod == anchorPeriod."Splits";
def isEsdAnchor = ancEarn or ancDivi or ancSpli;

def isNewPeriod = if IsNaN(Source[1]) and !isEsdAnchor then yes else isNewPeriod1;

def _vwap   = f_Vwap(Source, isNewPeriod, 1, offset).wap;
def _stdevUpper = f_Vwap(Source, isNewPeriod, stdevMult, offset).dev;
def vwapCond = (hideonDWM and isdwm);

def vwapValue; def stdevAbs;
if !vwapCond {
    vwapValue = _vwap;
    stdevAbs = if showStdvBand then _stdevUpper else na;
    } else {
    vwapValue = na;
    stdevAbs = na;
}

def last5gain = high - low[divergenceLookback];
def last5loss = high[divergenceLookback] - low;

def atr = atr(Length = 14);

def gaps = fold i = 0 to divergenceLookback with p do
    if AbsValue(open[i] - GetValue(close, i+1)) > atr then yes else p;
def hh = highest(high, 20);
def ll = lowest(low, 20);
def range = hh - ll;
def bullishDivergenceBool;
if gaps == yes {
    bullishDivergenceBool = no;
    } else {
    bullishDivergenceBool = close>close[1] and vwapValue[0]<vwapValue[1] and last5gain > atr*divergenceATRmultiplier and (bar_index - lastBullishDivergence > 15 or (range >atr*2 and bar_index - lastBullishDivergence > 10));
}

lastBullishDivergence1 = if bullishDivergenceBool then bar_index else lastBullishDivergence;

def bearishDivergenceBool;
if gaps == yes {
    bearishDivergenceBool = no;
    } else {
    bearishDivergenceBool = close<close[1] and vwapValue[0]>vwapValue[1] and last5loss > atr*divergenceATRmultiplier and (bar_index - lastBearishDivergence > 15 or (range>atr*2 and bar_index - lastBearishDivergence > 10));
}
lastBearishDivergence1 = if bearishDivergenceBool then bar_index else lastBearishDivergence;

#-- Plots
def vwapCol = if alternateColor then if vwapValue > vwapValue[1] then 1 else -1 else 0;

plot vwapLine = if showVWAP then vwapValue else na;    # "VWAP"
vwapLine.AssignValueColor(if vwapCol > 0 then Color.GREEN else
                          if vwapCol < 0 then Color.RED else Color.MAGENTA);

plot stdevBandUp = vwapValue + stdevAbs;
plot stdevBandDn = vwapValue - stdevAbs;

stdevBandUp.SetStyle(Curve.SHORT_DASH);
stdevBandDn.SetStyle(Curve.SHORT_DASH);
stdevBandUp.AssignValueColor(if vwapCol > 0 then Color.DARK_GREEN else
                          if vwapCol < 0 then Color.DARK_RED else Color.PLUM);

stdevBandDn.AssignValueColor(if vwapCol > 0 then Color.DARK_GREEN else
                          if vwapCol < 0 then Color.DARK_RED else Color.PLUM);
#// bullish divergence
plot BullDiv = if Wedge and bullishDivergenceBool then low else na;
BullDiv.SetDefaultColor(GetColor(1));
BullDiv.SetPaintingStrategy(PaintingStrategy.BOOLEAN_WEDGE_DOWN);
BullDiv.SetLineWeight(2);

AddChartBubble(bubble and bullishDivergenceBool, low , "B", GetColor(1), no);

#// bearish divergence
plot BearDiv = if Wedge and bearishDivergenceBool then high else na;
BearDiv.SetDefaultColor(GetColor(2));
BearDiv.SetPaintingStrategy(PaintingStrategy.BOOLEAN_WEDGE_UP);
BearDiv.SetLineWeight(2);

AddChartBubble(bubble and bearishDivergenceBool, high, "B", GetColor(2));    # "Bearish Divergence Dot"


#-- END of CODE
Last edited by a moderator: