
Author Message:
Core Aspects:
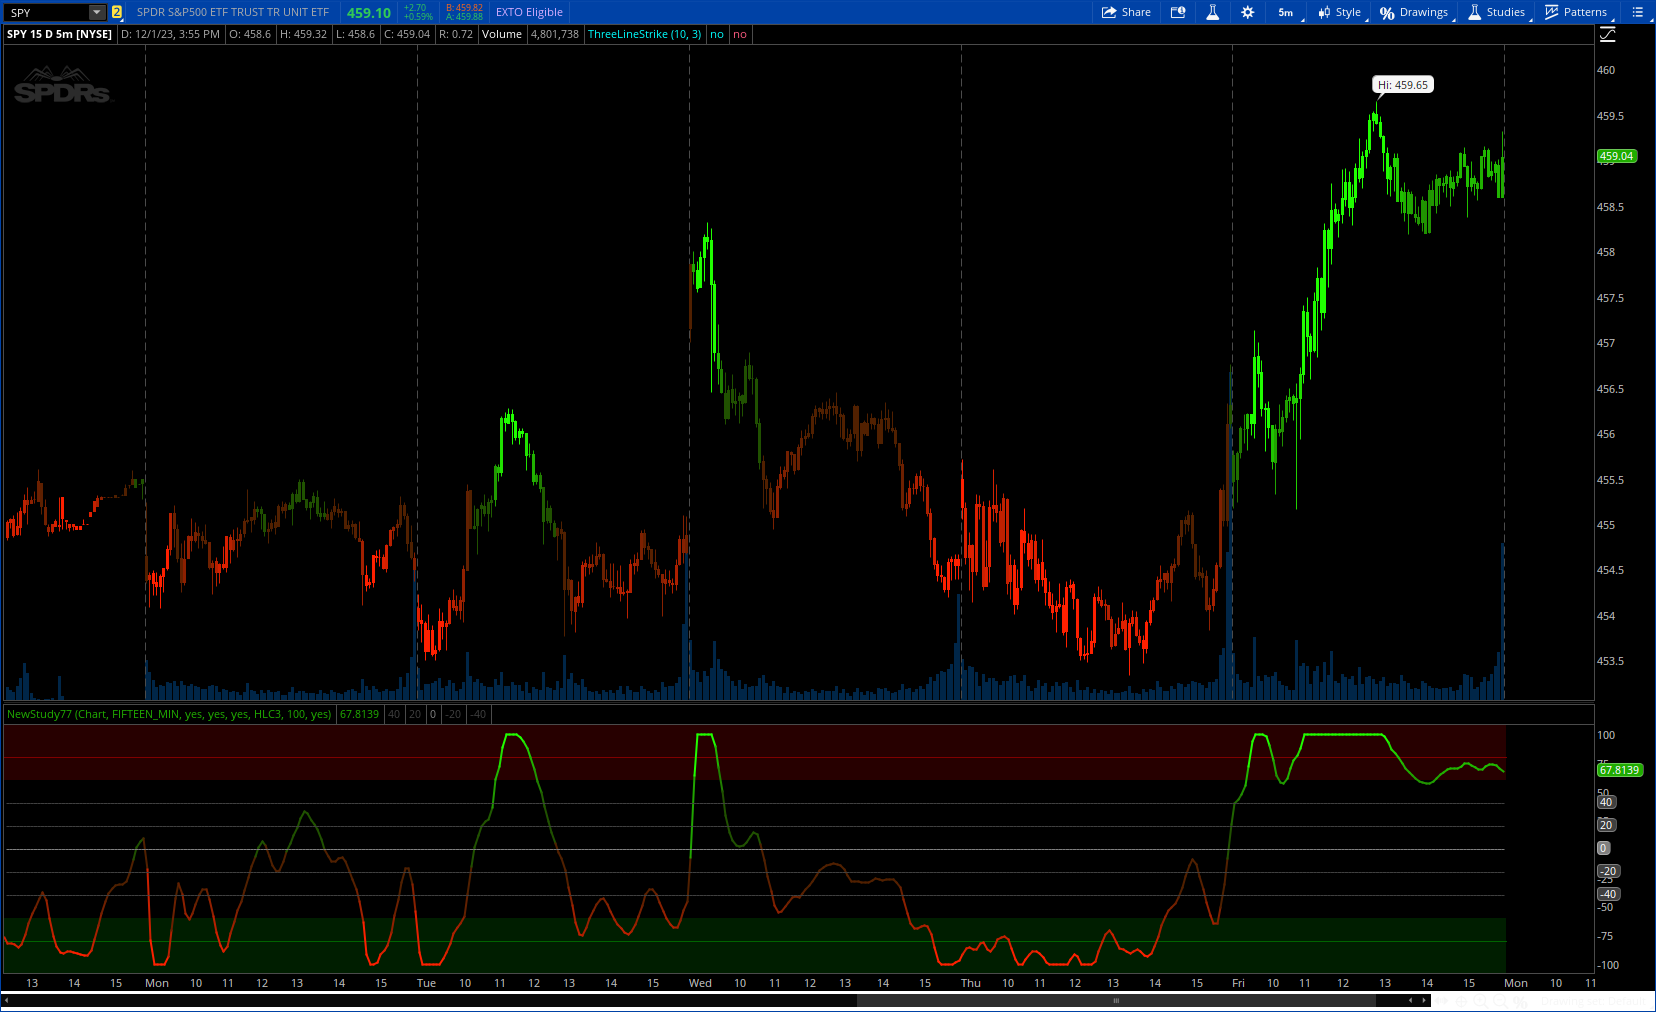
- The script calculates the VWAP by considering both volume and price data, offering a comprehensive view of market activity.
- Uses an adaptive normalization function to balance the data, ensuring that the VWAP reflects current market conditions accurately.
- The oscillator includes customizable settings such as VWAP source, lookback period, and buffer percentage.
- Provides a clear visual representation of market trends.
CSS:
#// https://www.tradingview.com/v/vKpmM4Sk/
#// This Pine Script™ code is subject to the terms of the Mozilla Public License 2.0
#// © godzcopilot
#//  Thanks to LazyBear for WaveTrend Oscillator https://www.tradingview.com/script/2KE8wTuF-Indicator-
#indicator("VWAP Oscillator" (Normalised), shorttitle="VWAP-O",
# Converted and mod by Sam4Cok@Samer800    - 12/2023
Declare Lower;
#// Inputs
input timeframe = {Default "Chart", "Custom"};
input customTimeframe = AggregationPeriod.FIFTEEN_MIN;
input colorBars = yes;
input showGrid = yes;                        # "Show Grid Levels"
input showVWAP = yes;                        # "Show VWAP"
input vwapSrc = FundamentalType.HLC3;        # 'VWAP Source'
input NormalisedPeriod = 100;                # "VWAP Lookback Period"
input smoothedVwap = yes;

def na = Double.NaN;
def last = !isNaN(close);
#--- MTF
def tfS = Fundamental(FundamentalType = vwapSrc);
def tfV = Volume;
def tfC = close;
def mtfS = Fundamental(FundamentalType = vwapSrc, Period = customTimeframe);
def mtfV = Volume(Period = customTimeframe);
def mtfC = close(Period = customTimeframe);
def src; def v; def c;
Switch (timeframe) {
Case "Custom" :
    src = mtfS;
    v   = mtfV;
    c   = mtfC;
Default :
    src = tfS;
    v   = tfV;
    c   = tfC;
}
#// Function Definitions
#// VWAP Calculation Function
Script computeVWAP {
input src = hlc3;
input Vol = Volume;
    def SrcVol = src * Vol;
    def sumSrcVol = if isNaN(sumSrcVol[1]) then srcVol else
                    CompoundValue(1, srcVol + sumSrcVol[1], SrcVol);
    def sumVol = if isNaN(sumVol[1]) then vol else
                    CompoundValue(1, vol + sumVol[1], Vol);
    def _vwap = sumSrcVol / sumVol;
    plot out = _vwap;
}
#// Adaptive Normalization Function without Buffer
Script adaptiveNormalize {
input data = hlc3;
input period = 100;
    def minValue = lowest(data, period);
    def maxValue = highest(data, period);
    def normalized = (200 * (data - minValue) / (maxValue - minValue)) - 100;
    plot out = normalized;
}
#// Function to Linearly Extend Extremes
Script linearExtendExtremes {
input normalizedData = hlc3;
input rawValue = close;
input rateOfChangePeriod = 5;
input extremeThreshold = 100;
    def adjustedValue; def direction; def avgRateOfChange;def excess;#= normalizedData
    if AbsValue(normalizedData) >= extremeThreshold {
        direction = sign(normalizedData);
        avgRateOfChange = AbsValue(Average(rawValue-rawValue[1], rateOfChangePeriod));
        excess = AbsValue(normalizedData) - extremeThreshold;
        adjustedValue = direction * (extremeThreshold + excess + avgRateOfChange);
    } else {
        direction = 0;#direction[1];
        avgRateOfChange = 0;#avgRateOfChange[1];
        excess = 0;#excess[1];
        adjustedValue = normalizedData;
    }
    plot out = adjustedValue;
}
#/ Calculations
#// Define the threshold for extreme values and period for rate of change calculation
def extremeThreshold = 100;#
def rateOfChangePeriod = 5;#  // Adjust this period based on your data characteristics
#// VWAP Calculations
def vwapValue = computeVWAP(src, v);
def difference = (c / vwapValue - 1) * 100;
def smooth = EhlersSuperSmootherFilter(difference, 10);
def diff = if smoothedVwap then smooth else difference;
#// Apply Normalization and Linear Extension to Extremes
def normalizedVWAP = adaptiveNormalize(diff, NormalisedPeriod);
def adjustedVWAP = linearExtendExtremes(normalizedVWAP, diff, rateOfChangePeriod, extremeThreshold);


#/ Plotting
def AbsVwap = AbsValue(adjustedVWAP);
def col = if AbsVwap > 90 then 100 else
          if AbsVwap > 50 then AbsVwap else
          if AbsVwap < 30 then  32 else AbsVwap;# else 0;
def rbg = col * 2.55;

#// Normalized VWAP Oscillator Plot
plot p_VWAP = if showVWAP then adjustedVWAP else na;    # 'Normalized VWAP Oscillator'

p_VWAP.SetLineWeight(2);
p_VWAP.AssignValueColor(if adjustedVWAP > 0 then CreateColor(32, rbg, 0) else
                        if adjustedVWAP < 0 then CreateColor(rbg, 32, 0) else Color.GRAY);

#// Horizontal Lines
#// Upper and Lower Threshold Lines
def pos = Double.POSITIVE_INFINITY;
def neg = Double.NEGATIVE_INFINITY;
#def uline100 = if last[1] and showGrid then 100 else na;
def uline80  = if last[1] then 80 else na;
def uline60  = if last[1] then 60 else na;
plot uline40  = if last and showGrid then 40 else na;
plot uline20  = if last and showGrid then 20 else na;
plot midline0 = if last and showGrid then 0 else na;
plot dline20  = if last and showGrid then -20 else na;
plot dline40  = if last and showGrid then -40 else na;
def dline60  = if last[1] then -60 else na;
def dline80  = if last[1] then -80 else na;
#def dline100 = if last[1] and showGrid then -100 else na;

AddCloud(pos, uline80, Color.DARK_RED, Color.DARK_RED, showGrid);
AddCloud(uline80, uline60, Color.DARK_RED);
AddCloud(dline60, dline80, Color.DARK_GREEN);
AddCloud(dline80, neg, Color.DARK_GREEN, Color.DARK_GREEN, showGrid);

uline40.SetDefaultColor(Color.DARK_GRAY);
uline20.SetDefaultColor(Color.DARK_GRAY);
midline0.SetDefaultColor(Color.GRAY);
dline20.SetDefaultColor(Color.DARK_GRAY);
dline40.SetDefaultColor(Color.DARK_GRAY);

uline40.SetPaintingStrategy(PaintingStrategy.DASHES);
uline20.SetPaintingStrategy(PaintingStrategy.DASHES);
midline0.SetPaintingStrategy(PaintingStrategy.DASHES);
dline20.SetPaintingStrategy(PaintingStrategy.DASHES);
dline40.SetPaintingStrategy(PaintingStrategy.DASHES);

#-- Bar Color

AssignPriceColor(if !colorBars then Color.CURRENT else
                 if adjustedVWAP > 0 then CreateColor(32, rbg, 0) else
                 if adjustedVWAP < 0 then CreateColor(rbg, 32, 0) else Color.GRAY);

#-- END of CODE