VWAP Crosses, Format, Watchlist, Label, Scan for ThinkorSwim

BenTen

Administrative
Staff member
Staff
VIP
Lifetime
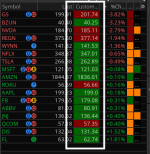
I wanted to quickly know if the stock price is currently above or below VWAP (Volume Weighted Average Price). One of our developers were able to help me put together a watchlist column that shows just that. Here is what it looks like.

Shared WatchList Link: http://tos.mx/X7jLAge Click here for --> Easiest way to load shared links
7P8f0QI.png


Notes:
  • Green means price is currently above VWAP
  • Red means price is currently below VWAP

thinkScript Code

Rich (BB code):
plot vwap = vwap();
AssignBackgroundColor(if close > vwap then Color.DARK_GREEN else if close < vwap then Color.DARK_RED else Color.Dark_ORANGE);

Credit:
  • WalkingBallista
 

Attachments

  • 7P8f0QI.png
    7P8f0QI.png
    73.3 KB · Views: 207
Last edited by a moderator:

Join useThinkScript to post your question to a community of 21,000+ developers and traders.

@BenTen In your opinion, how does it help determine action decision?

 
Last edited:
@BenTen Hopefully not to sound confusing, how does that make a definite sure thing buy/sell/hold? So let's say for example it suddenly turns green, is this bullish mode? What does the orange indicate?

 
Last edited:
@Likos There is no orange on that specific column that was something else. Here is a good article on different ways to trade using VWAP.

 
Last edited:
@BenTen

@BenTen, Can you clarify this is Script for indicator? After i created the indicator using above script i get full chart Orange color?

 
Last edited:
@San This is not an indicator. Click Customize on your Watchlist > Custom Quotes > select one of the of the custom column and just paste the code in there.

r6qZnZr.png


Attachments

  • r6qZnZr.png
    r6qZnZr.png
    52.9 KB · Views: 123
Last edited:
1) What time frame are you using?

2) Can the code be edited to just show Last for indexes like SPX and NDX, instead of NaN?

Thinking about removing Last column to make some space.

Saw your post "https://tos.mx/MREYid this is an Intraday VWAP that also works on Android" and was wondering if there was anything to it (Intraday vs just plain VWAP).
 
Last edited:
To learn even more about VWAP, see Brian Shannon, CMT, who wrote a book on it.
https://t.co/Irh2y5lhZa and www.AlphaTrends.net
Also, check out his daily YouTube postings.
@thinky Any timeframe will work, some are just more reliable than others. Check out Brians info above.

@thinky nothing special at all, on my Android. It seems to start from the 2nd day on a one day 5 minute chart or on the 4th day on a 3 day 15 minute chart. I do not know why at this point.
It is a VWAP that happens to work on Android intraday only. That is the way that Mobius built it. BTW, I tried on a 10 day and one hour chart and android showed me 12 days. However, the VWAP did seem to restart every day at the open. It may be buggy, do your Due Diligence. If it doesn't work properly then don't use it.

UPDATE:
I found out where the bug was on android. When using the intraday VWAP on android, you must have "use extended hours" turned ON.
 
Last edited by a moderator:
Hey guys I'm looking for a watchlist script for a 9EMA cross Vwap..With the background color coded to the up/downside....also plot how many bars ago this happened...I've found many online but not like this...

Thanks
 
Give this a try

Code:
# Price crossing above or below 9 EMA and VWAP
# By BenTen of useThinkScript.com

declare upper;

# Moving Average
input priceMA = close;
input lengthMA = 9;
input displace = 0;
input showBreakoutSignals = yes;
input price = close;

def EMA = ExpAverage(priceMA[-displace], lengthMA);

# VWAP
input numDevDn = -2.0;
input numDevUp = 2.0;
input timeFrame = {default DAY, WEEK, MONTH};

def cap = GetAggregationPeriod();
def errorInAggregation =
    timeFrame == timeFrame.DAY and cap >= AggregationPeriod.WEEK or
    timeFrame == timeFrame.WEEK and cap >= AggregationPeriod.MONTH;
Assert(!errorInAggregation, "timeFrame should be not less than current chart aggregation period");

def yyyyMmDd = GetYYYYMMDD();
def periodIndx;
switch (timeFrame) {
case DAY:
    periodIndx = yyyyMmDd;
case WEEK:
    periodIndx = Floor((DaysFromDate(First(yyyyMmDd)) + GetDayOfWeek(First(yyyyMmDd))) / 7);
case MONTH:
    periodIndx = RoundDown(yyyyMmDd / 100, 0);
}
def isPeriodRolled = CompoundValue(1, periodIndx != periodIndx[1], yes);

def volumeSum;
def volumeVwapSum;
def volumeVwap2Sum;

if (isPeriodRolled) {
    volumeSum = volume;
    volumeVwapSum = volume * vwap;
    volumeVwap2Sum = volume * Sqr(vwap);
} else {
    volumeSum = CompoundValue(1, volumeSum[1] + volume, volume);
    volumeVwapSum = CompoundValue(1, volumeVwapSum[1] + volume * vwap, volume * vwap);
    volumeVwap2Sum = CompoundValue(1, volumeVwap2Sum[1] + volume * Sqr(vwap), volume * Sqr(vwap));
}
def priceVWAP = volumeVwapSum / volumeSum;
def deviation = Sqrt(Max(volumeVwap2Sum / volumeSum - Sqr(priceVWAP), 0));

def VWAP = priceVWAP;

def bullish_signal = EMA crosses above priceVWAP;
def bearish_signal = EMA crosses below priceVWAP;

# Plot Signals
plot bullish = bullish_signal;
bullish.SetPaintingStrategy(PaintingStrategy.BOOLEAN_ARROW_UP);
bullish.SetDefaultColor(Color.CYAN);
bullish.SetLineWeight(3);

plot bearish = bearish_signal;
bearish.SetPaintingStrategy(PaintingStrategy.BOOLEAN_ARROW_DOWN);
bearish.SetDefaultColor(Color.CYAN);
bearish.SetLineWeight(3);
 
Last edited:
Hi guys, one of my long strategies is to look for the 5EMA to reclaim/cross the VWAP to the upside on the 5min chart and was wondering if anyone could code an indicator for this. Preferably, when the cross happens, a label lights up in a strong color and when there is no cross happening, it stays in a grey color.

Can this be done?
 
@zeek See if this works. You can turn off the plots if confirm it is working.

9bjqsba.png


Code:
# 5 EMA and VWAP cross. Modified 2 ToS studies and added labels for crosses. By Horserider 7/21/2019

# TD Ameritrade IP Company, Inc. (c) 2011-2019
#

input timeFrame = {default DAY, WEEK, MONTH};

def cap = getAggregationPeriod();
def errorInAggregation =
    timeFrame == timeFrame.DAY and cap >= AggregationPeriod.WEEK or
    timeFrame == timeFrame.WEEK and cap >= AggregationPeriod.MONTH;
assert(!errorInAggregation, "timeFrame should be not less than current chart aggregation period");

def yyyyMmDd = getYyyyMmDd();
def periodIndx;
switch (timeFrame) {
case DAY:
    periodIndx = yyyyMmDd;
case WEEK:
    periodIndx = Floor((daysFromDate(first(yyyyMmDd)) + getDayOfWeek(first(yyyyMmDd))) / 7);
case MONTH:
    periodIndx = roundDown(yyyyMmDd / 100, 0);
}
def isPeriodRolled = compoundValue(1, periodIndx != periodIndx[1], yes);

def volumeSum;
def volumeVwapSum;
def volumeVwap2Sum;

if (isPeriodRolled) {
    volumeSum = volume;
    volumeVwapSum = volume * vwap;
    volumeVwap2Sum = volume * Sqr(vwap);
} else {
    volumeSum = compoundValue(1, volumeSum[1] + volume, volume);
    volumeVwapSum = compoundValue(1, volumeVwapSum[1] + volume * vwap, volume * vwap);
    volumeVwap2Sum = compoundValue(1, volumeVwap2Sum[1] + volume * Sqr(vwap), volume * Sqr(vwap));
}
def price = volumeVwapSum / volumeSum;


plot VWAP = price;


# TD Ameritrade IP Company, Inc. (c) 2017-2019
#

input price2 = close;
input length = 5;
input displace = 0;


plot AvgExp = ExpAverage(price2[-displace], length);


AddLabel(yes, "Buy ", if avgexp > vwap then Color.GREEN else color.GRAY);

AddLabel(yes, "Sell", if avgexp < vwap then Color.RED else color.GRAY);
 

Attachments

  • 9bjqsba.png
    9bjqsba.png
    95.1 KB · Views: 161
Is there is script that sound alerts you when candle crosses over or below vwap on the chart you are currently on. Sometimes you have multiple charts open and it would be nice to get an alert if a stock just touched vwap.
 
Try this, did it on the go so I have not tested it yet.

Code:
def bull_cross = close crosses above VWAP;
def bear_cross = close crosses below VWAP;

# Alerts
Alert(bull_cross, " ", Alert.Bar, Sound.Chimes);
Alert(bear_cross, " ", Alert.Bar, Sound.Bell);
 
@San This is not an indicator. Click Customize on your Watchlist > Custom Quotes > select one of the of the custom column and just paste the code in there.

Am I doing the right steps? I added this code as a study.
Then go to my watchlist>Custom Quotes. Filled in like this:
yd6YdNM.png

No colors on my watchlist though.
 

Attachments

  • yd6YdNM.png
    yd6YdNM.png
    223.5 KB · Views: 119
Any VWAP Cross Over Indicator with Moving Average?

Edit: Thanks to all, I thinks that script above resolve my question 👍 👍 👍
 

Similar threads

Not the exact question you're looking for?

Start a new thread and receive assistance from our community.

87k+ Posts
520 Online
Create Post

Similar threads

Similar threads

The Market Trading Game Changer

Join 2,500+ subscribers inside the useThinkScript VIP Membership Club
  • Exclusive indicators
  • Proven strategies & setups
  • Private Discord community
  • ‘Buy The Dip’ signal alerts
  • Exclusive members-only content
  • Add-ons and resources
  • 1 full year of unlimited support

Frequently Asked Questions

What is useThinkScript?

useThinkScript is the #1 community of stock market investors using indicators and other tools to power their trading strategies. Traders of all skill levels use our forums to learn about scripting and indicators, help each other, and discover new ways to gain an edge in the markets.

How do I get started?

We get it. Our forum can be intimidating, if not overwhelming. With thousands of topics, tens of thousands of posts, our community has created an incredibly deep knowledge base for stock traders. No one can ever exhaust every resource provided on our site.

If you are new, or just looking for guidance, here are some helpful links to get you started.

What are the benefits of VIP Membership?
VIP members get exclusive access to these proven and tested premium indicators: Buy the Dip, Advanced Market Moves 2.0, Take Profit, and Volatility Trading Range. In addition, VIP members get access to over 50 VIP-only custom indicators, add-ons, and strategies, private VIP-only forums, private Discord channel to discuss trades and strategies in real-time, customer support, trade alerts, and much more. Learn all about VIP membership here.
How can I access the premium indicators?
To access the premium indicators, which are plug and play ready, sign up for VIP membership here.
Back
Top