Hi all,
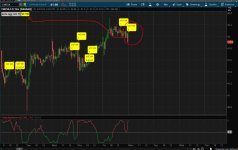
I’m trying to change the VolatilitySwitch indicator from a lower study to a study in my upper chart/price area, then add a label and a chart bubble when the indicator hits its highest level or 100%. I’ve moved the indicator up to the price area, plotted a “high” so I can use it for the label (the indicator already has a midline which I left in the code), and defined a "highsignal" so I can use it for the chart bubble. The label is working the way I want it to so I don't need any label help. I’m having two issues with the chart bubble: the first issue is that multiple bubbles are appearing at the very top of the screen which I think may be because of the “declare lower” line still in the code. However, when I remove that line, the entire indicator stops appearing in my upper chart altogether so I don’t know what to do but keep that line in the code. The second issue is that I only want one bubble to appear when the indicator first hits 100%; I don’t want the bubble to reprint for every candle as long as the indicator remains at its high. However, when the indicator goes down and then hits 100% again, I want to get a new bubble. (The label stays on during the entire time the indicator is at 100% but I only want one bubble to appear when the indicator first hits 100%.)
I need help getting the bubble to appear above the candle when the indicator first hits 100% instead of appearing at the top of the screen with multiple candles in a row. I’m new to coding and have only gotten to the point where I am by looking through this website and reading up on the thinkorswim Learning Center. Thanks for any help you can provide.
Here's the code with italicized notes showing changes I’ve made to the VolatilitySwitch's original code:
declare lower;
input length = 21;
#code added for aggperiod
def price2 = close(period = aggregationPeriod.TWO_Min);
Assert(length > 0, "'length' must be positive: " + length);
def dailyReturn = (price2 - price2[1]) / ( (price2 + price2[1]) / 2 );
def histVolatility = StDev(dailyReturn, length);
plot VolatilitySwitch = ( fold i = 0 to length with count do count + if histVolatility <= histVolatility then 1 else 0 ) / length;
plot MidLine = 0.5;
plot High = 1.0;#code added
def HighSignal = volatilityswitch >= High;#code added
VolatilitySwitch.DefineColor("Trending", Color.UPTICK);
VolatilitySwitch.DefineColor("Mean-Reverting", Color.DOWNTICK);
VolatilitySwitch.AssignValueColor(if VolatilitySwitch >= High then VolatilitySwitch.Color("Mean-Reverting") else VolatilitySwitch.Color("Trending"));
MidLine.SetDefaultColor(GetColor(7));
#AddLabel and AddChartBubble code added
AddLabel(yes, "2 Min VS", if volatilityswitch >= High then createcolor(249,233,167) else color.BLACK);#label background is black until condition is met
AddChartBubble(Highsignal, high, "2m", createcolor(249,233,167), no);