Merry,
QQ on Crosses Above.
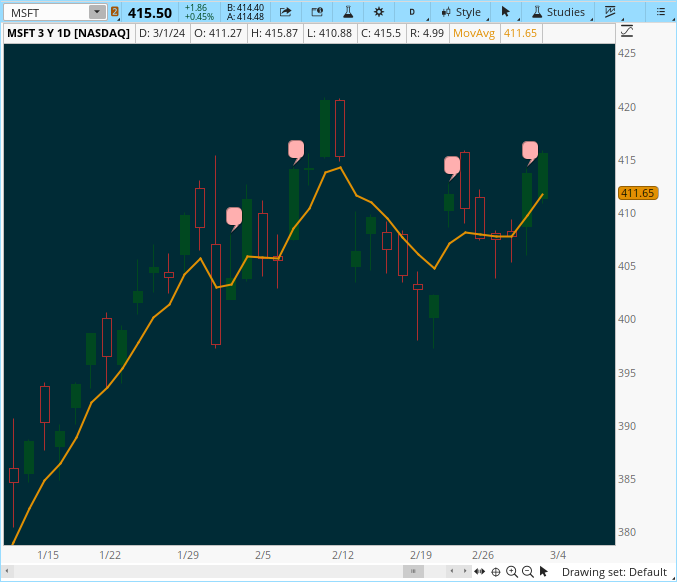
Close Crosses above means , we assume that if price moved around that moving average on that particular bar. But I am not seeing that in action .
For Example MSFT / NFLX / AVGO /DOCN / CROX which are sliced though 5 EMA on Daily candle . But in my watchlist column these are not flagged as Cross over happening today. They are showing as close above 5 EMA bucket but not falling under 5 EMA cross over bucket.
Not sure what did i miss. can you pls throw some light
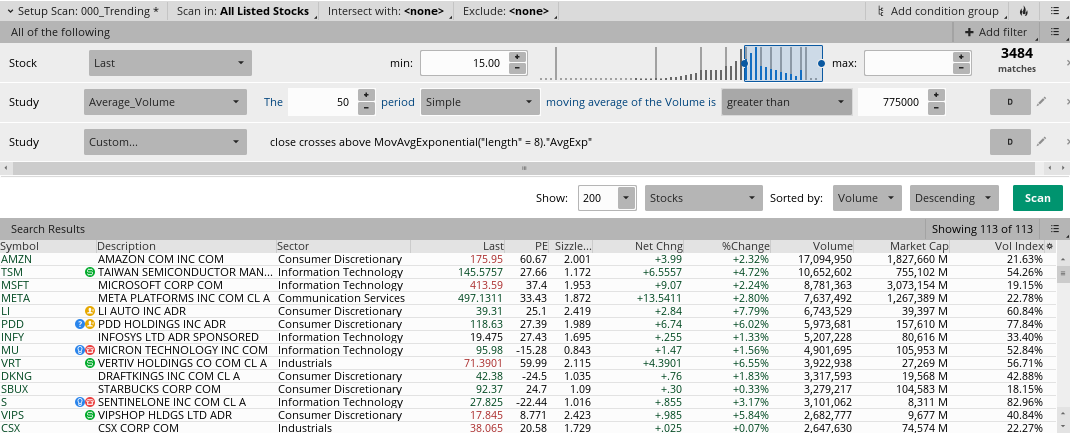
# To Find stocks which are sliced through 5 EMA Today
def ema5 = MovAvgExponential("length" = 5) ;
AddLabel (yes, if close crosses above ema5 then "5EMACrossOver" else "", color.green) ;
QQ on Crosses Above.
Close Crosses above means , we assume that if price moved around that moving average on that particular bar. But I am not seeing that in action .
For Example MSFT / NFLX / AVGO /DOCN / CROX which are sliced though 5 EMA on Daily candle . But in my watchlist column these are not flagged as Cross over happening today. They are showing as close above 5 EMA bucket but not falling under 5 EMA cross over bucket.
Not sure what did i miss. can you pls throw some light
# To Find stocks which are sliced through 5 EMA Today
def ema5 = MovAvgExponential("length" = 5) ;
AddLabel (yes, if close crosses above ema5 then "5EMACrossOver" else "", color.green) ;