# arrow_after_emax
#https://usethinkscript.com/threads/coding-questions.16368/
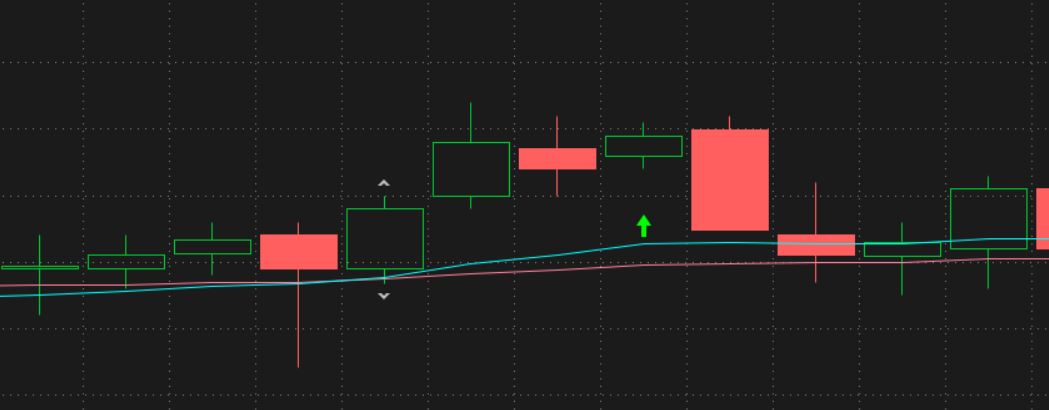
# code for a arrow signal, to show after a ema crossover, and the second candle close in that direction
def na = double.nan;
def bn = barnumber();
def up = close > open;
def dwn = close < open;
input count_after_cross = 2;
def price = close;
input ma1_len = 20;
input ma1_type = AverageType.EXPONENTIAL;
def ma1 = MovingAverage(ma1_type, price, ma1_len);
input ma2_len = 50;
input ma2_type = AverageType.EXPONENTIAL;
def ma2 = Movingaverage(ma2_type, price, ma2_len);
def xup = ma1 crosses above ma2;
def xdwn = ma1 crosses below ma2;
input show_lines = yes;
plot z1 = if show_lines then ma1 else na;
z1.setdefaultcolor(getcolor(1));
#z1.setlineweight(1);
z1.hidebubble();
plot z2 = if show_lines then ma2 else na;
z2.setdefaultcolor(getcolor(2));
#z2.setlineweight(1);
z2.hidebubble();
# cross up , up or down bar
def xupdir = if bn == 1 then 0
else if xdwn then 0
else if xup and up then 1
else if xup and dwn then -1
else if xupdir[1] > 0 and up then xupdir[1] + 1
else if xupdir[1] < 0 and dwn then xupdir[1] - 1
else xupdir[1];
# cross down , up or down bar
def xdwndir = if bn == 1 then 0
else if xdwn and up then 1
else if xdwn and dwn then -1
else if xdwndir[1] > 0 and up then xdwndir[1] + 1
else if xdwndir[1] < 0 and dwn then xdwndir[1] - 1
else xdwndir[1];
plot zupup = if count_after_cross == xupdir and count_after_cross != xupdir[1] then low*0.999 else na;
plot zupdwn = if count_after_cross == -xupdir and count_after_cross != -xupdir[1] then high*1.001 else na;
zupup.SetPaintingStrategy(PaintingStrategy.ARROW_UP);
zupup.SetDefaultColor(Color.green);
zupup.setlineweight(3);
zupup.hidebubble();
zupdwn.SetPaintingStrategy(PaintingStrategy.ARROW_DOWN);
zupdwn.SetDefaultColor(Color.red);
zupdwn.setlineweight(3);
zupdwn.hidebubble();
input show_cross_wedges = yes;
plot zxup1 = if show_cross_wedges and xup then 1 else 0;
zxup1.SetPaintingStrategy(PaintingStrategy.BOOLEAN_WEDGE_up);
zxup1.SetDefaultColor(Color.light_gray);
zxup1.setlineweight(2);
zxup1.hidebubble();
plot zxup2 = if show_cross_wedges and xup then 1 else 0;
zxup2.SetPaintingStrategy(PaintingStrategy.BOOLEAN_WEDGE_down);
zxup2.SetDefaultColor(Color.light_gray);
zxup2.setlineweight(2);
zxup2.hidebubble();
plot zxdwn1 = if show_cross_wedges and xdwn then 1 else 0;
zxdwn1.SetPaintingStrategy(PaintingStrategy.BOOLEAN_WEDGE_up);
zxdwn1.SetDefaultColor(Color.light_gray);
zxdwn1.setlineweight(2);
zxdwn1.hidebubble();
plot zxdwn2 = if show_cross_wedges and xdwn then 1 else 0;
zxdwn2.SetPaintingStrategy(PaintingStrategy.BOOLEAN_WEDGE_DOWN);
zxdwn2.SetDefaultColor(Color.light_gray);
zxdwn2.setlineweight(2);
zxdwn2.hidebubble();
#------------------------
addchartbubble(0, low,
xupdir
, color.yellow, no);
#