Vertical line and Opening Price

AdalWolf

New member
Hello Guys,
I am looking for a script for TOS that can put a vertical line at midnight NY time (custom Time zone even better) and a horizontal line for the opening price of midnight and 8:30 open. Are there any scripts similar to this? I do have script Trading View but I am not from the coding background so I can make it for TOS. Please help! Here are codes for Trading VIew:
https://www.tradingview.com/script/Pt0Kk3PV-ICT-NEW-YORK-MIDNIGHT-OPEN-AND-8-30-AM-OPEN/

Thank you in Advance🙏🏻
@FutureTony
 
Last edited by a moderator:
Solution
Great indicator, instead of the open can it be made to plot the line at the close at first 930 bar, and can the line agg on the 15min agg and yet show on a 5 min agg. chart

Here is 15m close @0930 on a 5m chart with a vertical line @0930. The line on the 5m moves until the 15m opening bar closes

Screenshot 2024-01-26 151505.png
Code:
#Midnight_Vertical_Open_830_Vertical_Open
input openingTime1 = 0930;
input openingTime2 = 0930;
input agg          = AggregationPeriod.FIFTEEN_MIN;
input showvertical = yes;
input showbubble   = yes;


def sec1 = SecondsFromTime(openingTime1);
def sec2 = SecondsFromTime(openingTime2);
def isTime1 = (sec1 >= 0 and sec1[1] < 0) or (sec1 < sec1[1] and sec1 >= 0);
def isTime2 = (sec2 >= 0 and sec2[1] < 0) or (sec2 <...
Great indicator, instead of the open can it be made to plot the line at the close at first 930 bar, and can the line agg on the 15min agg and yet show on a 5 min agg. chart

Here is 15m close @0930 on a 5m chart with a vertical line @0930. The line on the 5m moves until the 15m opening bar closes

Screenshot 2024-01-26 151505.png
Code:
#Midnight_Vertical_Open_830_Vertical_Open
input openingTime1 = 0930;
input openingTime2 = 0930;
input agg          = AggregationPeriod.FIFTEEN_MIN;
input showvertical = yes;
input showbubble   = yes;


def sec1 = SecondsFromTime(openingTime1);
def sec2 = SecondsFromTime(openingTime2);
def isTime1 = (sec1 >= 0 and sec1[1] < 0) or (sec1 < sec1[1] and sec1 >= 0);
def isTime2 = (sec2 >= 0 and sec2[1] < 0) or (sec2 < sec2[1] and sec2 >= 0);

def  cl1   = if isTime1 then close(period = agg) else cl1[1];
plot close1 = cl1;
close1.SetPaintingStrategy(PaintingStrategy.HORIZONTAL);

AddVerticalLine(showvertical and isTime1, " ", close1.TakeValueColor(), Curve.FIRM);

input bubblemover = 2;
def   b = bubblemover;

AddChartBubble(showbubble and IsNaN(close[b]) and !IsNaN(close[b + 1]), close1[b + 1], agg / 60000 + "m \nClose\n@" + openingTime1 + "\n" + AsText(close1[b + 1]), close1.TakeValueColor());

#
 
Solution

Join useThinkScript to post your question to a community of 21,000+ developers and traders.

This allows you to choose or not to display the verticallines.

Good afternoon @SleepyZ, I was looking at this indicator in post#12
https://usethinkscript.com/threads/vertical-line-and-opening-price.11725/#post-109045
and wondered if it was possible to add other parameters like 2 different time frames and a show expansion-only function.

I want to add to the indicator in post #12 the function to draw horizontal lines for two different time frames (for example Asia high and low 20:00 to 0:00 hours and London high and low 2:00 to 5:00 am) and that each of the two time frames could be activated or deactivated separately as well as their vertical lines, as is currently possible with the vertical lines for midnight and 830.

And also add a show expansion-only function.

Thank you very much in advance for your help.
 
Last edited:
Good afternoon @SleepyZ, I was looking at this indicator in post#12
https://usethinkscript.com/threads/vertical-line-and-opening-price.11725/#post-109045
and wondered if it was possible to add other parameters like 2 different time frames and a show expansion-only function.

I want to add to the indicator in post #12 the function to draw horizontal lines for two different time frames (for example Asia high and low 20:00 to 0:00 hours and London high and low 2:00 to 5:00 am) and that each of the two time frames could be activated or deactivated separately as well as their vertical lines, as is currently possible with the vertical lines for midnight and 830.

And also add a show expansion-only function.

Thank you very much in advance for your help.

This has the added request
There are input options at the beginning that relate to all time periods
There are individual input display options
The image shows the todayonly option with showing verticals in the upper panel
The image shows the expansion only option

Screenshot 2024-08-27 182411.png
Code:
#Midnight_Vertical_Open_830_Vertical_Open_Rutures_Version
#modified to work on Futures with addition of 2 other periods highs/lows

input showverticals = yes;
input todayonly     = no;
input showexpansion = no;
input showbubbles   = yes;
input bubblemover   = 3;

def bm  = bubblemover;
def bm1 = bm + 1;

#Defines Trading Days for Futures
def ymd = GetYYYYMMDD();
def ct  = if ymd != ymd[1] and !IsNaN(close) then ct[1] + 1 else ct[1];
def ct1 = HighestAll(ct) - ct + 1;

#-------------------------------------------
input showopeningtimes   = yes;
input showopeningbubbles = yes;
input openingTime1  = 0000;
input openingTime2  = 0830;

def sec1 = SecondsFromTime(openingTime1);
def sec2 = SecondsFromTime(openingTime2);
def isTime1 = (sec1 >= 0 and sec1[1] < 0) or (sec1 < sec1[1] and sec1 >= 0);
def isTime2 = (sec2 >= 0 and sec2[1] < 0) or (sec2 < sec2[1] and sec2 >= 0);

#Defines openingtime for each day to limit plots when todayonly chosen - Similar use for each plot below
def  op1   = if isTime1 then open else op1[1];
def ctop1  = if op1 != op1[1] and !IsNaN(close) then ctop1[1] + 1 else ctop1[1];
def cond1  = HighestAll(ctop1) - ctop1 + 1;

plot open1 = if showopeningtimes then if (todayonly and cond1 > 1) or (showexpansion and !IsNaN(close)) then Double.NaN else op1 else Double.NaN;
open1.SetDefaultColor(Color.CYAN);
open1.SetPaintingStrategy(PaintingStrategy.HORIZONTAL);

AddVerticalLine(if !showverticals or todayonly and ct1 > 1 then Double.NaN else if todayonly and ct1[1] == 2 and ct == 1 then Double.NaN else isTime1, "Midnight ", open1.TakeValueColor(), Curve.FIRM);
AddChartBubble(if !showbubbles or !showopeningbubbles then Double.NaN else IsNaN(close[bm]) and !IsNaN(close[bm1]) or showexpansion and !IsNaN(open1[bm]) and IsNaN(open1[bm]), open1, "Midnight", open1.TakeValueColor());

def  op2   = if isTime2 then open else op2[1];
def ctop2  = if op2 != op2[1] and !IsNaN(close) then ctop2[1] + 1 else ctop2[1];
def cond2  = HighestAll(ctop2) - ctop2 + 1;

plot open2 = if showopeningtimes then if (todayonly and cond2 > 1) or (GetDay() == GetLastDay() and sec2 < 0) or (showexpansion and !IsNaN(close)) then Double.NaN else op2 else Double.NaN;
open2.SetDefaultColor(Color.DARK_ORANGE);
open2.SetPaintingStrategy(PaintingStrategy.HORIZONTAL);

AddVerticalLine(if !showverticals then Double.NaN else if todayonly and GetDay() != GetLastDay() then Double.NaN else isTime2, "Time " + AsPrice(openingTime2),  open2.TakeValueColor(), Curve.FIRM);

AddChartBubble(if !showbubbles or !showopeningbubbles then Double.NaN else IsNaN(close[bm]) and !IsNaN(close[bm1]  or showexpansion and !IsNaN(open1[bm]) and IsNaN(open1[bm])), open2, "830", open2.TakeValueColor(), no);

#-------------------------------------
input showtimes1        = yes;
input showtimes1bubbles = yes;
input openTime1  = 2000;
input closeTime1 = 0000;

def sec1a = SecondsFromTime(openTime1);
def sec2a = SecondsFromTime(closeTime1);
def isTime1a = (sec1a >= 0 and sec1a[1] < 0) or (sec1a < sec1a[1] and sec1a >= 0);
def isTime2a = (sec2a >= 0 and sec2a[1] < 0) or (sec2a < sec2a[1] and sec2a >= 0);
def inRange = CompoundValue(1, if isTime1a then 1 else if isTime2a then 0 else inRange[1], 0);

def  Hi1   = if IsNaN(close) then Hi1[1] else if isTime1a then high else if inRange and high > Hi1[1] then high else Hi1[1];
def chi1   = if Hi1 != Hi1[1] and !IsNaN(close) then chi1[1] + 1 else chi1[1];
def chi1a  = HighestAll(chi1) - chi1 + 1;

plot High1 = if showtimes1 then if (todayonly and cHi1a > 1) or (showexpansion and !IsNaN(close)) then Double.NaN else Hi1 else Double.NaN;
High1.SetDefaultColor(Color.WHITE);
High1.SetPaintingStrategy(PaintingStrategy.HORIZONTAL);

AddVerticalLine(if !showverticals then Double.NaN else if todayonly and ct1 > 1 then Double.NaN else isTime1a, "Time " + AsPrice(openTime1), High1.TakeValueColor(), Curve.FIRM);
AddChartBubble(if !showbubbles or !showtimes1bubbles then Double.NaN else IsNaN(close[bm]) and !IsNaN(close[bm1]) or showexpansion and !IsNaN(High1[bm]) and IsNaN(High1[bm]), High1, "Asia H", High1.TakeValueColor());

def  Lo1  = if IsNaN(close) then Lo1[1] else if isTime1a then low else if inRange and low < Lo1[1] then low else Lo1[1];
def cLo1   = if Lo1 != Lo1[1] and !IsNaN(close) then cLo1[1] + 1 else cLo1[1];
def cLo1a  = HighestAll(cLo1) - cLo1 + 1;

plot Low1 = if showtimes1 then if (todayonly and cLo1a > 1) or (showexpansion and !IsNaN(close)) then Double.NaN else Lo1 else Double.NaN;
Low1.SetDefaultColor(Color.WHITE);
Low1.SetPaintingStrategy(PaintingStrategy.HORIZONTAL);

AddVerticalLine(visible = if !showverticals then Double.NaN else if todayonly and ct > 1 then Double.NaN else isTime2a, "Time " + AsPrice(closeTime1), color = Low1.TakeValueColor());

AddChartBubble(if !showbubbles or !showtimes1bubbles then Double.NaN else IsNaN(close[bm]) and !IsNaN(close[bm1]  or showexpansion and !IsNaN(Low1[bm]) and IsNaN(Low1[bm])), Low1, "Asia L", Low1.TakeValueColor(), no);

#-------------------------------------
input showtimes2        = yes;
input showtimes2bubbles = yes;
input openTime2  = 0200;
input closeTime2 = 0500;

def sec1b = SecondsFromTime(openTime2);
def sec2b = SecondsFromTime(closeTime2);
def isTime1b = (sec1b >= 0 and sec1b[1] < 0) or (sec1b < sec1b[1] and sec1b >= 0);
def isTime2b = (sec2b >= 0 and sec2b[1] < 0) or (sec2b < sec2b[1] and sec2b >= 0);
def inRangeb = CompoundValue(1, if isTime1b then 1 else if isTime2b then 0 else inRangeb[1], 0);

def  Hi2   = if IsNaN(close) then Hi2[1] else if isTime1b then high else if inRangeb and high > Hi2[1] then high else Hi2[1];
def chi2   = if Hi2 != Hi2[1] and !IsNaN(close) then chi2[1] + 1 else chi2[1];
def chi2a  = HighestAll(chi2) - chi2 + 1;

plot High2 = if showtimes2 then if (todayonly and chi2a > 1) or (showexpansion and !IsNaN(close)) then Double.NaN else Hi2 else Double.NaN;
High2.SetDefaultColor(Color.YELLOW);
High2.SetPaintingStrategy(PaintingStrategy.HORIZONTAL);

AddVerticalLine(if !showverticals then Double.NaN else if todayonly and ct1 > 1 then Double.NaN else isTime1b, "Time " + AsPrice(openTime2), High2.TakeValueColor(), Curve.FIRM);

AddChartBubble(if !showbubbles or !showtimes2bubbles then Double.NaN else IsNaN(close[bm]) and !IsNaN(close[bm1]) or showexpansion and !IsNaN(High2[bm]) and IsNaN(High2[bm]), High2, "London H", High2.TakeValueColor());

def  Lo2  = if IsNaN(close) then Lo2[1] else if isTime1b then low else if inRangeb and low < Lo2[1] then low else Lo2[1];
def cLo2   = if Lo2 != Lo2[1] and !IsNaN(close) then cLo2[1] + 1 else cLo2[1];
def cLo2a  = HighestAll(cLo2) - cLo2 + 1;

plot Low2 = if showtimes2 then if (todayonly and cLo2a > 1) or (showexpansion and !IsNaN(close)) then Double.NaN else Lo2 else Double.NaN;
Low2.SetDefaultColor(Color.YELLOW);
Low2.SetPaintingStrategy(PaintingStrategy.HORIZONTAL);

AddVerticalLine(if !showverticals then Double.NaN else if todayonly and ct1 > 1 then Double.NaN else isTime2b, "Time " + AsPrice(closeTime2), color = Low2.TakeValueColor());

AddChartBubble(if !showbubbles or !showtimes2bubbles then Double.NaN else IsNaN(close[bm]) and !IsNaN(close[bm1]  or showexpansion and !IsNaN(Low2[bm]) and IsNaN(Low2[bm])), Low2, "London L", Low2.TakeValueColor(), no);

#
 
This has the added request
There are input options at the beginning that relate to all time periods
There are individual input display options
The image shows the todayonly option with showing verticals in the upper panel
The image shows the expansion only option
Hi SleepyZ, could you please add the option to have the date show vertically along the line?
 
Hi SleepyZ, could you please add the option to have the date show vertically along the line?

Optional Date added to Vertical Lines

Screenshot 2024-09-11 165836.jpg
Code:
#Midnight_Vertical_Open_830_Vertical_Open_Rutures_Version
#modified to work on Futures with addition of 2 other periods highs/lows
#added date option to verticallnes

input showverticals = yes;
input todayonly     = no;
input showexpansion = no;
input showbubbles   = yes;
input bubblemover   = 3;

def bm  = bubblemover;
def bm1 = bm + 1;

#Defines Trading Days for Futures
def ymd = GetYYYYMMDD();
def ct  = if ymd != ymd[1] and !IsNaN(close) then ct[1] + 1 else ct[1];
def ct1 = HighestAll(ct) - ct + 1;

#-------------------------------------------
input showopeningtimes   = yes;
input showopeningbubbles = yes;
input showvertical_dates = yes;
input openingTime1  = 0000;
input openingTime2  = 0830;

def sec1 = SecondsFromTime(openingTime1);
def sec2 = SecondsFromTime(openingTime2);
def isTime1 = (sec1 >= 0 and sec1[1] < 0) or (sec1 < sec1[1] and sec1 >= 0);
def isTime2 = (sec2 >= 0 and sec2[1] < 0) or (sec2 < sec2[1] and sec2 >= 0);

#Defines openingtime for each day to limit plots when todayonly chosen - Similar use for each plot below
def  op1   = if isTime1 then open else op1[1];
def ctop1  = if op1 != op1[1] and !IsNaN(close) then ctop1[1] + 1 else ctop1[1];
def cond1  = HighestAll(ctop1) - ctop1 + 1;

plot open1 = if showopeningtimes then if (todayonly and cond1 > 1) or (showexpansion and !IsNaN(close)) then Double.NaN else op1 else Double.NaN;
open1.SetDefaultColor(Color.CYAN);
open1.SetPaintingStrategy(PaintingStrategy.HORIZONTAL);

def verticaldate1 = if isTime1 then GetYYYYMMDD() else Double.NaN;

AddVerticalLine(if !showverticals or todayonly and ct1 > 1 then Double.NaN else if todayonly and ct1[1] == 2 and ct == 1 then Double.NaN else isTime1, "Midnight " + (if !showvertical_dates then "" else "    " + AsPrice(verticaldate1)), open1.TakeValueColor(), Curve.FIRM);

AddChartBubble(if !showbubbles or !showopeningbubbles then Double.NaN else IsNaN(close[bm]) and !IsNaN(close[bm1]) or showexpansion and !IsNaN(open1[bm]) and IsNaN(open1[bm]), open1, "Midnight", open1.TakeValueColor());

#------------------------------------
def  op2   = if isTime2 then open else op2[1];
def ctop2  = if op2 != op2[1] and !IsNaN(close) then ctop2[1] + 1 else ctop2[1];
def cond2  = HighestAll(ctop2) - ctop2 + 1;

plot open2 = if showopeningtimes then if (todayonly and cond2 > 1) or (GetDay() == GetLastDay() and sec2 < 0) or (showexpansion and !IsNaN(close)) then Double.NaN else op2 else Double.NaN;
open2.SetDefaultColor(Color.DARK_ORANGE);
open2.SetPaintingStrategy(PaintingStrategy.HORIZONTAL);

def verticaldate2 = if isTime2 then GetYYYYMMDD() else Double.NaN;

AddVerticalLine(if !showverticals then Double.NaN else if todayonly and GetDay() != GetLastDay() then Double.NaN else isTime2, "Time " + AsPrice(openingTime2) + "   " + (if !showvertical_dates then "" else "   " + AsPrice(verticaldate2)),  open2.TakeValueColor(), Curve.FIRM);

AddChartBubble(if !showbubbles or !showopeningbubbles then Double.NaN else IsNaN(close[bm]) and !IsNaN(close[bm1]  or showexpansion and !IsNaN(open1[bm]) and IsNaN(open1[bm])), open2, "830", open2.TakeValueColor(), no);

#-------------------------------------
input showtimes1        = yes;
input showtimes1bubbles = yes;
input openTime1  = 2000;
input closeTime1 = 0000;

def sec1a = SecondsFromTime(openTime1);
def sec2a = SecondsFromTime(closeTime1);
def isTime1a = (sec1a >= 0 and sec1a[1] < 0) or (sec1a < sec1a[1] and sec1a >= 0);
def isTime2a = (sec2a >= 0 and sec2a[1] < 0) or (sec2a < sec2a[1] and sec2a >= 0);
def inRange = CompoundValue(1, if isTime1a then 1 else if isTime2a then 0 else inRange[1], 0);

def  Hi1   = if IsNaN(close) then Hi1[1] else if isTime1a then high else if inRange and high > Hi1[1] then high else Hi1[1];
def chi1   = if Hi1 != Hi1[1] and !IsNaN(close) then chi1[1] + 1 else chi1[1];
def chi1a  = HighestAll(chi1) - chi1 + 1;

plot High1 = if showtimes1 then if (todayonly and chi1a > 1) or (showexpansion and !IsNaN(close)) then Double.NaN else Hi1 else Double.NaN;
High1.SetDefaultColor(Color.WHITE);
High1.SetPaintingStrategy(PaintingStrategy.HORIZONTAL);

def verticaldate3 = if openTime1 then GetYYYYMMDD() else Double.NaN;

AddVerticalLine(if !showverticals then Double.NaN else if todayonly and ct1 > 1 then Double.NaN else isTime1a, "Time " + AsPrice(openTime1) + (if !showvertical_dates then "" else "   " + AsPrice(verticaldate3)), High1.TakeValueColor(), Curve.FIRM);

AddChartBubble(if !showbubbles or !showtimes1bubbles then Double.NaN else IsNaN(close[bm]) and !IsNaN(close[bm1]) or showexpansion and !IsNaN(High1[bm]) and IsNaN(High1[bm]), High1, "Asia H", High1.TakeValueColor());

#------------------------------------
def  Lo1  = if IsNaN(close) then Lo1[1] else if isTime1a then low else if inRange and low < Lo1[1] then low else Lo1[1];
def cLo1   = if Lo1 != Lo1[1] and !IsNaN(close) then cLo1[1] + 1 else cLo1[1];
def cLo1a  = HighestAll(cLo1) - cLo1 + 1;

plot Low1 = if showtimes1 then if (todayonly and cLo1a > 1) or (showexpansion and !IsNaN(close)) then Double.NaN else Lo1 else Double.NaN;
Low1.SetDefaultColor(Color.WHITE);
Low1.SetPaintingStrategy(PaintingStrategy.HORIZONTAL);

def verticaldate4 = if showvertical_dates and isTime2a then GetYYYYMMDD() else Double.NaN;

AddVerticalLine(visible = if !showverticals then Double.NaN else if todayonly and ct > 1 then Double.NaN else isTime2a, "Time " + AsPrice(closeTime1) + (if !showvertical_dates then "" else "    " + AsPrice(verticaldate4)), color = Low1.TakeValueColor());

AddChartBubble(if !showbubbles or !showtimes1bubbles then Double.NaN else IsNaN(close[bm]) and !IsNaN(close[bm1]  or showexpansion and !IsNaN(Low1[bm]) and IsNaN(Low1[bm])), Low1, "Asia L", Low1.TakeValueColor(), no);

#-------------------------------------
input showtimes2        = yes;
input showtimes2bubbles = yes;
input openTime2  = 0200;
input closeTime2 = 0500;

def sec1b = SecondsFromTime(openTime2);
def sec2b = SecondsFromTime(closeTime2);
def isTime1b = (sec1b >= 0 and sec1b[1] < 0) or (sec1b < sec1b[1] and sec1b >= 0);
def isTime2b = (sec2b >= 0 and sec2b[1] < 0) or (sec2b < sec2b[1] and sec2b >= 0);
def inRangeb = CompoundValue(1, if isTime1b then 1 else if isTime2b then 0 else inRangeb[1], 0);

def  Hi2   = if IsNaN(close) then Hi2[1] else if isTime1b then high else if inRangeb and high > Hi2[1] then high else Hi2[1];
def chi2   = if Hi2 != Hi2[1] and !IsNaN(close) then chi2[1] + 1 else chi2[1];
def chi2a  = HighestAll(chi2) - chi2 + 1;

plot High2 = if showtimes2 then if (todayonly and chi2a > 1) or (showexpansion and !IsNaN(close)) then Double.NaN else Hi2 else Double.NaN;
High2.SetDefaultColor(Color.YELLOW);
High2.SetPaintingStrategy(PaintingStrategy.HORIZONTAL);

def verticaldate5 = if showvertical_dates and openTime2 then GetYYYYMMDD() else Double.NaN;

AddVerticalLine(if !showverticals then Double.NaN else if todayonly and ct1 > 1 then Double.NaN else isTime1b, "Time " + AsPrice(openTime2) + (if !showvertical_dates then "" else "    " + AsPrice(verticaldate5)), High2.TakeValueColor(), Curve.FIRM);

AddChartBubble(if !showbubbles or !showtimes2bubbles then Double.NaN else IsNaN(close[bm]) and !IsNaN(close[bm1]) or showexpansion and !IsNaN(High2[bm]) and IsNaN(High2[bm]), High2, "London H", High2.TakeValueColor());

#--------------------------------------
def  Lo2  = if IsNaN(close) then Lo2[1] else if isTime1b then low else if inRangeb and low < Lo2[1] then low else Lo2[1];
def cLo2   = if Lo2 != Lo2[1] and !IsNaN(close) then cLo2[1] + 1 else cLo2[1];
def cLo2a  = HighestAll(cLo2) - cLo2 + 1;

plot Low2 = if showtimes2 then if (todayonly and cLo2a > 1) or (showexpansion and !IsNaN(close)) then Double.NaN else Lo2 else Double.NaN;
Low2.SetDefaultColor(Color.YELLOW);
Low2.SetPaintingStrategy(PaintingStrategy.HORIZONTAL);

def verticaldate6 = if showvertical_dates and closeTime2 then GetYYYYMMDD() else Double.NaN;

AddVerticalLine(if !showverticals then Double.NaN else if todayonly and ct1 > 1 then Double.NaN else isTime2b, "Time " + AsPrice(closeTime2) + (if !showvertical_dates then "" else "    " + AsPrice(verticaldate6)), color = Low2.TakeValueColor());

AddChartBubble(if !showbubbles or !showtimes2bubbles then Double.NaN else IsNaN(close[bm]) and !IsNaN(close[bm1]  or showexpansion and !IsNaN(Low2[bm]) and IsNaN(Low2[bm])), Low2, "London L", Low2.TakeValueColor(), no);

#
 
Optional Date added to Vertical Lines
Hi Sleepyz,

I'm trying to use cycles with my chart and wanted to have the date on the line appear every X days to coincide with an X day cycle, i.e., 20 days for a 20 day cycle. Could you please adjust the code so this new script can be used to show a vertical line and date every X days?
 
Hi Sleepyz,

I'm trying to use cycles with my chart and wanted to have the date on the line appear every X days to coincide with an X day cycle, i.e., 20 days for a 20 day cycle. Could you please adjust the code so this new script can be used to show a vertical line and date every X days?

Input the start date and days in cycle to create the verticals.
Make sure the start date is a trading day date.
Use only on a Daily Chart

Screenshot 2024-09-26 101405.jpg
Code:
#Example_Verticals_x_TradingDays_Cycle_from_Start_Date
#For use on a Daily Chart only

input start_date    = 20231229;
input days_in_cycle = 20;
def ymd = GetYYYYMMDD();
def bn  = if start_date == ymd then 1 else bn[1] + 1;

AddVerticalLine(bn == 1, AsPrice(ymd), Color.WHITE);
AddVerticalLine(if ymd < start_date then Double.NaN else bn % days_in_cycle == 0, AsPrice(ymd), Color.WHITE);

#
 
Hi @SleepyZ,
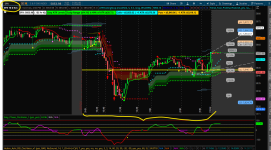
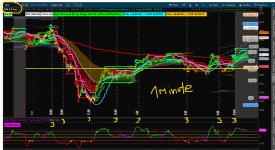
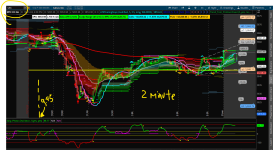
I'm trying to code an indicator that plots vertical intraday time zones in any chart frame, but I have some problems. It looks like it works ok on 3- or 5-minute charts, but when I change the chart to 1 minute, the indicator plots 3 vertical plots for each time zone. In the 2-minute chart, the 9:45 time zone is not shown. I'm attaching the indicator code and some screenshots. Thank you in advance for your help.

input ShowTodayOnly = yes;

def Today = if GetDay() == GetLastDay() then 1 else 0;
def DisplayKillZones = if (ShowTodayOnly AND Today) then 1 else if !ShowTodayOnly then 1 else 0;

# Define a small range around each time (e.g., +/- 1 minute)
def range = 60; # seconds

# Add vertical lines for specified time zones
addVerticalLine(secondsFromTime(945) == 0 && DisplayKillZones, text="9:45", color.white, curve.Points);
addVerticalLine(secondsFromTime(1020) >= -range && secondsFromTime(1020) <= range && DisplayKillZones, text="10:20", color.white, curve.Points);
addVerticalLine(secondsFromTime(1040) >= -range && secondsFromTime(1040) <= range && DisplayKillZones, text="10:40", color.white, curve.Points);
addVerticalLine(secondsFromTime(1130) >= -range && secondsFromTime(1130) <= range && DisplayKillZones, text="11:30", color.white, curve.Points);
addVerticalLine(secondsFromTime(1220) >= -range && secondsFromTime(1220) <= range && DisplayKillZones, text="12:20", color.white, curve.Points);
addVerticalLine(secondsFromTime(1300) >= -range && secondsFromTime(1300) <= range && DisplayKillZones, text="1:00", color.white, curve.Points);
addVerticalLine(secondsFromTime(1430) >= -range && secondsFromTime(1430) <= range && DisplayKillZones, text="2:30", color.white, curve.Points);
addVerticalLine(secondsFromTime(1530) >= -range && secondsFromTime(1530) <= range && DisplayKillZones, text="3:30", color.white, curve.Points);
addVerticalLine(secondsFromTime(1600) >= -range && secondsFromTime(1600) <= range && DisplayKillZones, text="Close", color.white, curve.Points);
 

Attachments

  • Screenshot 2024-10-21 5_Minute_Chart.png
    Screenshot 2024-10-21 5_Minute_Chart.png
    170.7 KB · Views: 46
  • Screenshot 2024-10-21 1_Minute_Chart.png
    Screenshot 2024-10-21 1_Minute_Chart.png
    246.3 KB · Views: 43
  • Screenshot 2024-10-21 2_Minute_Chart.png
    Screenshot 2024-10-21 2_Minute_Chart.png
    220.1 KB · Views: 44
Hi @SleepyZ,
I'm trying to code an indicator that plots vertical intraday time zones in any chart frame, but I have some problems. It looks like it works ok on 3- or 5-minute charts, but when I change the chart to 1 minute, the indicator plots 3 vertical plots for each time zone. In the 2-minute chart, the 9:45 time zone is not shown. I'm attaching the indicator code and some screenshots. Thank you in advance for your help.

input ShowTodayOnly = yes;

def Today = if GetDay() == GetLastDay() then 1 else 0;
def DisplayKillZones = if (ShowTodayOnly AND Today) then 1 else if !ShowTodayOnly then 1 else 0;

# Define a small range around each time (e.g., +/- 1 minute)
def range = 60; # seconds

# Add vertical lines for specified time zones
addVerticalLine(secondsFromTime(945) == 0 && DisplayKillZones, text="9:45", color.white, curve.Points);
addVerticalLine(secondsFromTime(1020) >= -range && secondsFromTime(1020) <= range && DisplayKillZones, text="10:20", color.white, curve.Points);
addVerticalLine(secondsFromTime(1040) >= -range && secondsFromTime(1040) <= range && DisplayKillZones, text="10:40", color.white, curve.Points);
addVerticalLine(secondsFromTime(1130) >= -range && secondsFromTime(1130) <= range && DisplayKillZones, text="11:30", color.white, curve.Points);
addVerticalLine(secondsFromTime(1220) >= -range && secondsFromTime(1220) <= range && DisplayKillZones, text="12:20", color.white, curve.Points);
addVerticalLine(secondsFromTime(1300) >= -range && secondsFromTime(1300) <= range && DisplayKillZones, text="1:00", color.white, curve.Points);
addVerticalLine(secondsFromTime(1430) >= -range && secondsFromTime(1430) <= range && DisplayKillZones, text="2:30", color.white, curve.Points);
addVerticalLine(secondsFromTime(1530) >= -range && secondsFromTime(1530) <= range && DisplayKillZones, text="3:30", color.white, curve.Points);
addVerticalLine(secondsFromTime(1600) >= -range && secondsFromTime(1600) <= range && DisplayKillZones, text="Close", color.white, curve.Points);

The reason the verticalline at exactly secondsfromtime(945)==0 did not appear on a 2min chart is because that time does not appear there, but 944 and 946 do, The time, 945 / 2min (472.5) must be a whole integer to exactly equal 0 in the secondsfromtime(xxxx) function == 0.

To plot a '945' on the 2min chart, use this:

addVerticalLine(secondsFromTime(945)[1] <= 0 && secondsFromTime(945) > 0 && DisplayKillZones, text="9:45", color.white, curve.Points);

It looks like you have creatively tried to use the def range do cover above '945' situation in the rest of your code. If so, the following replaces all of times as done for the '945.'
Code:
input ShowTodayOnly = yes;

def Today = if GetDay() == GetLastDay() then 1 else 0;
def DisplayKillZones = if (ShowTodayOnly and Today) then 1 else if !ShowTodayOnly then 1 else 0;

# Define a small range around each time (e.g., +/- 1 minute)
#def range = if getaggregationPeriod()==aggregationPeriod.MIN then 0 else 60; # seconds

# Add vertical lines for specified time zones
AddVerticalLine(SecondsFromTime(945)[1] <= 0 && SecondsFromTime(945) > 0 && DisplayKillZones, text = "9:45", Color.WHITE, Curve.POINTS);

AddVerticalLine(SecondsFromTime(1020)[1] <= 0 && SecondsFromTime(1020) > 0 && DisplayKillZones, text = "10:20", Color.WHITE, Curve.POINTS);
AddVerticalLine(SecondsFromTime(1040)[1] <= 0 && SecondsFromTime(1040) > 0 && DisplayKillZones, text = "10:40", Color.WHITE, Curve.POINTS);
AddVerticalLine(SecondsFromTime(1130)[1] <= 0 && SecondsFromTime(1130) > 0 && DisplayKillZones, text = "11:30", Color.WHITE, Curve.POINTS);
AddVerticalLine(SecondsFromTime(1220)[1] <= 0 && SecondsFromTime(1220) > 0 && DisplayKillZones, text = "12:20", Color.WHITE, Curve.POINTS);
AddVerticalLine(SecondsFromTime(1300)[1] <= 0 && SecondsFromTime(1300) > 0 && DisplayKillZones, text = "1:00", Color.WHITE, Curve.POINTS);
AddVerticalLine(SecondsFromTime(1430)[1] <= 0 && SecondsFromTime(1430) > 0 && DisplayKillZones, text = "2:30", Color.WHITE, Curve.POINTS);
AddVerticalLine(SecondsFromTime(1530)[1] <= 0 && SecondsFromTime(1530) > 0 && DisplayKillZones, text = "3:30", Color.WHITE, Curve.POINTS);
AddVerticalLine(SecondsFromTime(1600)[1] <= 0 && SecondsFromTime(1600) > 0 && DisplayKillZones, text = "Close", Color.WHITE, Curve.POINTS);

#
 
The reason the verticalline at exactly secondsfromtime(945)==0 did not appear on a 2min chart is because that time does not appear there, but 944 and 946 do, The time, 945 / 2min (472.5) must be a whole integer to exactly equal 0 in the secondsfromtime(xxxx) function == 0.

To plot a '945' on the 2min chart, use this:

addVerticalLine(secondsFromTime(945)[1] <= 0 && secondsFromTime(945) > 0 && DisplayKillZones, text="9:45", color.white, curve.Points);

It looks like you have creatively tried to use the def range do cover above '945' situation in the rest of your code. If so, the following replaces all of times as done for the '945.'
Thanks, @SleepyZ, I will start testing the new code.
 

Similar threads

Not the exact question you're looking for?

Start a new thread and receive assistance from our community.

87k+ Posts
363 Online
Create Post

Similar threads

Similar threads

The Market Trading Game Changer

Join 2,500+ subscribers inside the useThinkScript VIP Membership Club
  • Exclusive indicators
  • Proven strategies & setups
  • Private Discord community
  • ‘Buy The Dip’ signal alerts
  • Exclusive members-only content
  • Add-ons and resources
  • 1 full year of unlimited support

Frequently Asked Questions

What is useThinkScript?

useThinkScript is the #1 community of stock market investors using indicators and other tools to power their trading strategies. Traders of all skill levels use our forums to learn about scripting and indicators, help each other, and discover new ways to gain an edge in the markets.

How do I get started?

We get it. Our forum can be intimidating, if not overwhelming. With thousands of topics, tens of thousands of posts, our community has created an incredibly deep knowledge base for stock traders. No one can ever exhaust every resource provided on our site.

If you are new, or just looking for guidance, here are some helpful links to get you started.

What are the benefits of VIP Membership?
VIP members get exclusive access to these proven and tested premium indicators: Buy the Dip, Advanced Market Moves 2.0, Take Profit, and Volatility Trading Range. In addition, VIP members get access to over 50 VIP-only custom indicators, add-ons, and strategies, private VIP-only forums, private Discord channel to discuss trades and strategies in real-time, customer support, trade alerts, and much more. Learn all about VIP membership here.
How can I access the premium indicators?
To access the premium indicators, which are plug and play ready, sign up for VIP membership here.
Back
Top