Ultimate RSI Indicator for ThinkorSwim

horserider

Well-known member
VIP
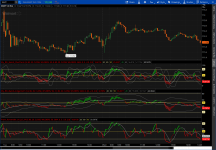
A double RSI indicator with standard deviation bands of the RSI. The very important RSI 50 line and coloring of the RSI lines for strength and weakness with a could to show when the two RSI lines separate. This would indicate a stronger move.

The Midline of the RSI bands works the same as the Market Mover with crossover of the RSI and Midline giving the signals.

The bands and 80 / 20 lines will show when RSI is very strong in one direction or the other. It can be traded the same as BBs by trading from top to bottom band and vice versa, that would be for the most adventurous trader.

The cross of the RSI and Midline would be the next step down in risk for a trade, while that same cross along with a cross of the 50 line would be the conservative trade entry or exit.

The RSI is not an oversold/overbought indicator, it is a strength indicator. So when RSI is high it is telling you the trend is strong, low shows trend is weak. So even when high and falling if it does not break the 50 line the up trend is most likely to continue. So always keep in mind the importance of the 50 line.

I will put up two versions one for scalping types which will match Market Mover signals (without scaling problems and zooming) and one for swing trading types.

Any feedback or questions are welcome.

Short term
Long term
Skeleton of RSI and SMA short term

dAuPS33.png


Short term
https://tos.mx/N6WBa1

Long term
https://tos.mx/lpvzpv
 

Attachments

  • dAuPS33.png
    dAuPS33.png
    189.4 KB · Views: 1,483

Join useThinkScript to post your question to a community of 21,000+ developers and traders.

I like your indicator and wanted advice. I watched a You Tube video for VectorVest using the Larry Connors RSI 2 system. But they want you to buy a $2400 course and it will be included in their software and will also have a watch list such as S&P500 etc to scan. How can I get a script for TOS. The rules are: find a stock that is "above" the 200 day SMA, is "below" the 5 day SMA and a 2 period RSI "below" 10. I have not been able to find this combination. Any help would be appreciated. I don't know coding so be gentle. LOL. Thank You,
Mike d.
 
@doeman as it's the weekend, things are a little slow. I have a Connors RSI 2 system that's gathering dust somewhere.
Don't wait for me, I might not find it.
Your homework: 😀
  • In the Tutorial section is this: https://usethinkscript.com/threads/how-to-drive-the-tos-scanner.284/
  • I'm pretty sure stockcharts.com has something on it as well. Google Connors RSI 2, you'll find rabbit holes to go down.
  • Dig through the videos on YouTube under Theotrade, one of the instructors there explained the system and possibly had a share included.
If, after going through the Scan Tutorial, you still need help, just ask here and someone should be able to help you make one. Markos
 
@doeman Thanks
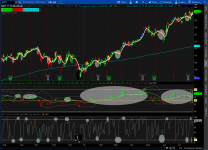
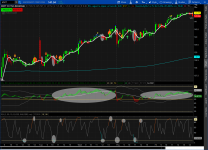
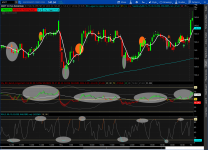
I looked at your RSI 2 strategy. It does present trades but you did not specify what the exit is, so I assumed it was RSI > 90. The charts show how it might work. Only trade long when over 200 SMA or short when under . THe exit was to be when price breaks 5 SMA . It ends up close to RSI > 90 exit. The RSI 2 has been proven to be a winning strategy but I believe takes lots of trades and may be best if the trading is automated.
Gray circles entry , orange exit.
Since this is Ultimate RSI thread I highlighted how you might have traded it.
94uq0G5.png

nS4hb5s.png


Since mainly designed for shorter trading here it is at 5 min.
Zx1POm8.png
 

Attachments

  • 94uq0G5.png
    94uq0G5.png
    248.3 KB · Views: 346
  • nS4hb5s.png
    nS4hb5s.png
    167.8 KB · Views: 310
  • Zx1POm8.png
    Zx1POm8.png
    176.9 KB · Views: 459
I like your indicator and wanted advice. I watched a You Tube video for VectorVest using the Larry Connors RSI 2 system. But they want you to buy a $2400 course and it will be included in their software and will also have a watch list such as S&P500 etc to scan. How can I get a script for TOS. The rules are: find a stock that is "above" the 200 day SMA, is "below" the 5 day SMA and a 2 period RSI "below" 10. I have not been able to find this combination. Any help would be appreciated. I don't know coding so be gentle. LOL. Thank You,
Mike d.

Hi first post here! Thought Id' contribute as I ran into this awesome RSI study by accident. I actually just finished creating the Connors Indicator,Cumulative RSI, Connors TPS, and Connors 3R's along corresponding chart studies with labels.

The chart labels for the Connors RSI, which you asked about specifically, includes the next day entry limit target per the Connor RSI strategy. The limit for the further pullback is customizable, but since I was in a hurry the percentages you have use decimals - e.g closing with 10% of low you would input .10 and for the limit entry the next day if 6% you would input .06. Here are the lower indicators(that also include signals if the conditions are me) and the chart studies. Hope this helps you. I made these for myself so they are quick and dirty but work as intended. The Connors RSI strategies are all available as PDFs

Connors RSI Lower
https://tos.mx/bFYSCF
Connors RSI Chart Study with entries
https://tos.mx/31rITE
Cummulative RSI2 Lower
https://tos.mx/9jNvU6
Cummlative RSI2 with chart labels
https://tos.mx/fsVk8O
Im super busy with life but please look at these and make adjustments as you see fit. Should be easy if you like the studies to change the parameters and make them look more appealing. Thanks!
 
Hi Horserider@ Many thanks for the indicators! I could strip away and get the lower indicator version myself - But since you already have it and I'm really busy could you send me the lowest indicator on the first post? I don't need the bollinger bands, or cloud but graphically I like the RSI lines, color, plotting and styles of the RSI and RSI average plots. Also think the lowest version would have a very good chance of working on mobile. So if you could kindly provide the stripped down versions it will save me some coding time. Really appreciate it!
 
Hi first post here! Thought Id' contribute as I ran into this awesome RSI study by accident. I actually just finished creating the Connors Indicator,Cumulative RSI, Connors TPS, and Connors 3R's along corresponding chart studies with labels.
The Connors RSI strategies are all available as PDFs

Connors RSI Lower
https://tos.mx/bFYSCF
Connors RSI Chart Study with entries
https://tos.mx/31rITE
Cummulative RSI2 Lower
https://tos.mx/9jNvU6
Cummlative RSI2 with chart labels
https://tos.mx/fsVk8O
Im super busy with life but please look at these and make adjustments as you see fit. Should be easy if you like the studies to change the parameters and make them look more appealing. Thanks!
Hi @leakywaders , could you post a link for where to locate the Pdf's, please, Many thanks for your contribution.
 

Similar threads

Not the exact question you're looking for?

Start a new thread and receive assistance from our community.

87k+ Posts
550 Online
Create Post

Similar threads

Similar threads

The Market Trading Game Changer

Join 2,500+ subscribers inside the useThinkScript VIP Membership Club
  • Exclusive indicators
  • Proven strategies & setups
  • Private Discord community
  • ‘Buy The Dip’ signal alerts
  • Exclusive members-only content
  • Add-ons and resources
  • 1 full year of unlimited support

Frequently Asked Questions

What is useThinkScript?

useThinkScript is the #1 community of stock market investors using indicators and other tools to power their trading strategies. Traders of all skill levels use our forums to learn about scripting and indicators, help each other, and discover new ways to gain an edge in the markets.

How do I get started?

We get it. Our forum can be intimidating, if not overwhelming. With thousands of topics, tens of thousands of posts, our community has created an incredibly deep knowledge base for stock traders. No one can ever exhaust every resource provided on our site.

If you are new, or just looking for guidance, here are some helpful links to get you started.

What are the benefits of VIP Membership?
VIP members get exclusive access to these proven and tested premium indicators: Buy the Dip, Advanced Market Moves 2.0, Take Profit, and Volatility Trading Range. In addition, VIP members get access to over 50 VIP-only custom indicators, add-ons, and strategies, private VIP-only forums, private Discord channel to discuss trades and strategies in real-time, customer support, trade alerts, and much more. Learn all about VIP membership here.
How can I access the premium indicators?
To access the premium indicators, which are plug and play ready, sign up for VIP membership here.
Back
Top