TTM Reversion Bands for ThinkorSwim

BenTen

Administrative
Staff member
Staff
VIP
Lifetime
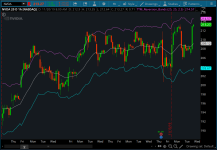
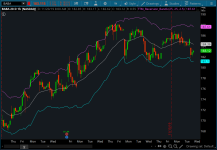
This indicator is called TTM Reversion Bands, and it's designed for mean reversion trading. When the stock's price is near the reversion bands, it's at an extreme and will generally revert to the mean over time.

In his book, John Carter shares insights on using this particular indicator for swing trading. He suggests first looking for "squeezes" and avoiding trades based on reversion-to-the-mean (RTM) during these squeezes, since they can be unpredictable.

Once a stock moves significantly above or below its average (a few ATRs), it's a good time to consider long or short options. Even better might be credit spreads, as time decay (theta) can work in your favor, even if the stock stays extended.

For settings, Carter recommends using 13, 13, 1.5 on a daily chart and 25, 25, 2.5 for intraday trading. This indicator is simple and effective for RTM strategies.

RWWMfZ6.png

jeVSm90.png


thinkScript Code

Code:
# TTM - Reversion Bands
# Assembled by BenTen at useThinkScript.com
# Converted from https://www.tradingview.com/script/JpAQTvZH-UCS-TTM-Reversion-Bands/

input length = 25;
input atrlen = 25;
input mult = 2.5;

def tr = Max(close[1], high) - Min(close[1], low);
def range = tr;

def ma = expAverage(close, length);
def rangema = expAverage(range, atrlen);
def upper = ma + rangema * mult;
def lower = ma - rangema * mult;

plot u = upper;
plot moving = ma;
plot l = lower;

u.setDefaultColor(getColor(0));
l.setDefaultColor(getColor(1));
moving.setDefaultColor(getColor(3));
 

Attachments

  • RWWMfZ6.png
    RWWMfZ6.png
    122.1 KB · Views: 285
  • jeVSm90.png
    jeVSm90.png
    118 KB · Views: 260
Last edited by a moderator:

Join useThinkScript to post your question to a community of 21,000+ developers and traders.

@RPrado You would have to make that decision yourself. Test it out and see if the indicator is something you would use on the daily or any other timeframe.
 
This is great! thank you I’m using this on one of my Strategy’s. Mean reversion plays of course with oversold / over bought indicator added thanks.

What’s the difference between this and bolinger bands?
 
John Carter speaks on this indicator in his book and gives some useful insight on how to use it for swing trading. To summarize he states to first look for squeezes and avoid reversion to the mean (RTM) during the squeeze as it is unpredictable. Once a stock makes a move that is a few ATR above/below the mean then look to go long/short options or better would be credit spreads as theta would actually help you even if it hangs around extended. The settings to use on the daily chart is recommended as 13, 13, 1.5 and for intraday 25, 25, 2.5. I like the indicator and feel it is one of simplest for RTM strategies.
 
I added the bands of this code to the "Trader Oracle Method" mid line and I'm happy with the results. Catches reversal levels well.

1723770018609.png


Code:
# @DaveTrade55
# indicator(title="TraderOracle Method", shorttitle="TO Method v1.6", overlay=true)
# Converted by Sam4Cok@Samer800    - 11/2023 - Request From UseThinkScript.com member


#// =-=-=  Nadaraya-Watson: Envelope (Non-Repainting) © jdehorty  =-=-=-=- //

input ShowResistanceCloud  = yes;    # "Show Resistance Cloud"
input LookbackWindow       = 256;    # 'Lookback Window'
input RelativeWeighting    = 3.50;   # 'Relative Weighting'
input StartRegressionAtBar = 30;     # "Start Regression at Bar"
input atrLength = 66;                # 'ATR Length'
input nearAtrFactor = 1.95;          # 'Near ATR Factor'
input farAtrFactor = 7.00;           # 'Far ATR Factor'

def na = Double.NaN;
def isconfirmed = !IsNaN(close);

Script rationalQuadratic {
input _src = close;
input _lookback = 256;
input _relativeWeight = 3.5;
input startAtBar = 30;
    def _size = if !isNaN(close) then 0 else 1;
    def _currentWeight = fold i = 0 to _size + startAtBar with p do
 p + GetValue(_src, i) * power(1 + (power(i, 2) / ((power(_lookback, 2) * 2 * _relativeWeight))), -_relativeWeight);
    def _cumulativeWeight = fold j = 0 to _size + startAtBar with q do
        q + power(1 + (power(j, 2) / ((power(_lookback, 2) * 2 * _relativeWeight))), -_relativeWeight);
    def yhat = _currentWeight / _cumulativeWeight;
    plot out = yhat;
}
Script getBounds {
input _atr = 1;
input _nearFactor = 1.95;
input _farFactor = 7.0;
input _yhat = close;
    def _upper_far = _yhat + _farFactor*_atr;
    def _upper_near = _yhat + _nearFactor*_atr;
    def _lower_near = _yhat - _nearFactor*_atr;
    def _lower_far = _yhat - _farFactor*_atr;
    def _upper_avg = (_upper_far + _upper_near) / 2;
    def _lower_avg = (_lower_far + _lower_near) / 2;
    plot upNear = _upper_near;
    plot upAvg = _upper_avg;
    plot loNear = _lower_near;
    plot loAvg = _lower_avg;
}
def yhat_close = rationalQuadratic(close, LookbackWindow, RelativeWeighting, StartRegressionAtBar);
def yhat_high = rationalQuadratic(high, LookbackWindow, RelativeWeighting, StartRegressionAtBar);
def yhat_low = rationalQuadratic(low, LookbackWindow, RelativeWeighting, StartRegressionAtBar);
def Kerneltr = TrueRange(yhat_high, yhat_close, yhat_low);
def ktr = WildersAverage(Kerneltr, atrLength);

def upper_near = getBounds(ktr, nearAtrFactor, farAtrFactor, yhat_close).upNear;
def upper_avg  = getBounds(ktr, nearAtrFactor, farAtrFactor, yhat_close).upAvg;
def lower_near = getBounds(ktr, nearAtrFactor, farAtrFactor, yhat_close).loNear;
def lower_avg  = getBounds(ktr, nearAtrFactor, farAtrFactor, yhat_close).loAvg;

def p_upper_avg  = if ShowResistanceCloud then upper_avg else na;    # 'Upper Boundary: Average'
def p_upper_near = if ShowResistanceCloud then upper_near else na;   # 'Upper Boundary: Near'
def p_lower_near = if ShowResistanceCloud then lower_near else na;   # 'Lower Boundary: Near'
def p_lower_avg  = if ShowResistanceCloud then lower_avg else na;    # 'Lower Boundary: Average'


#AddCloud(p_upper_near, p_upper_avg, Color.DARK_RED, color.dark_red, yes);        # 'Upper Boundary'
#createColor(153,0,153)
#AddCloud(p_lower_near, p_lower_avg, color.dark_green, createColor(153,153,255), yes);    # 'Lower Boundary'
#plot Sellsig = p_upper_near;
#plot Buysig = p_lower_near;
#Sellsig.setlineWeight(1);
#buysig.setlineWeight(1);
#sellsig.setdefaultColor(color.magenta);
#buysig.setdefaultcolor(color.cyan);
#plot Sellsig2 = p_upper_avg;
#plot Buysig2 = p_lower_avg;
#Sellsig2.setlineWeight(1);
#buysig2.setlineWeight(1);
#sellsig2.setdefaultColor(color.magenta);
#buysig2.setdefaultcolor(color.cyan);

def bullish = close < p_lower_near;
def bearish = close > p_upper_near;

AddLabel(yes, if bullish then "ORACLE-BUY" else if bearish then "ORACLE-SELL" else "", if bullish then color.green else if bearish then color.red else color.YELLOW);

plot mid = (p_upper_near -p_lower_near)/2 + p_lower_near;
mid.setDefaultColor(color.yellow);
mid.setlineWeight(4);
#mid.AssignValueColor(if mid > mid[1] then color.green else if mid < mid[1] then color.red else Color.GRAY);


# TTM - Reversion Bands
# Assembled by BenTen at useThinkScript.com
# Converted from https://www.tradingview.com/script/JpAQTvZH-UCS-TTM-Reversion-Bands/

input length = 25;
input atrlen = 25;
input mult = 1.0;
input mult1 = 2.5;
input mult2 = 3;
input mult3 = 5;

def tr = Max(close[1], high) - Min(close[1], low);
def range = tr;

def rangema = expAverage(range, atrlen);
def upper = mid + rangema * mult;
def lower = mid - rangema * mult;

plot u = upper;
plot l = lower;

u.setDefaultColor(color.dark_red);
l.setDefaultColor(color.dark_green);

def upper1 = mid + rangema * mult1;
def lower1 = mid - rangema * mult1;

plot u1 = upper1;
plot l1 = lower1;

u1.setDefaultColor(color.red);
l1.setDefaultColor(color.green);

def upper2 = mid + rangema * mult2;
def lower2 = mid - rangema * mult2;

plot u2 = upper2;
plot l2 = lower2;

u2.setDefaultColor(color.red);
l2.setDefaultColor(color.green);

AddCloud(u2, u1, Color.dark_RED, Color.dark_red);
AddCloud(l2, l1, Color.dark_green, Color.dark_GREEN);

def upper3 = mid + rangema * mult3;
def lower3 = mid - rangema * mult3;

plot u3 = upper3;
plot l3 = lower3;

u3.setDefaultColor(color.gray);
l3.setDefaultColor(color.gray);
 
Last edited:

Similar threads

Not the exact question you're looking for?

Start a new thread and receive assistance from our community.

87k+ Posts
154 Online
Create Post

Similar threads

Similar threads

The Market Trading Game Changer

Join 2,500+ subscribers inside the useThinkScript VIP Membership Club
  • Exclusive indicators
  • Proven strategies & setups
  • Private Discord community
  • ‘Buy The Dip’ signal alerts
  • Exclusive members-only content
  • Add-ons and resources
  • 1 full year of unlimited support

Frequently Asked Questions

What is useThinkScript?

useThinkScript is the #1 community of stock market investors using indicators and other tools to power their trading strategies. Traders of all skill levels use our forums to learn about scripting and indicators, help each other, and discover new ways to gain an edge in the markets.

How do I get started?

We get it. Our forum can be intimidating, if not overwhelming. With thousands of topics, tens of thousands of posts, our community has created an incredibly deep knowledge base for stock traders. No one can ever exhaust every resource provided on our site.

If you are new, or just looking for guidance, here are some helpful links to get you started.

What are the benefits of VIP Membership?
VIP members get exclusive access to these proven and tested premium indicators: Buy the Dip, Advanced Market Moves 2.0, Take Profit, and Volatility Trading Range. In addition, VIP members get access to over 50 VIP-only custom indicators, add-ons, and strategies, private VIP-only forums, private Discord channel to discuss trades and strategies in real-time, customer support, trade alerts, and much more. Learn all about VIP membership here.
How can I access the premium indicators?
To access the premium indicators, which are plug and play ready, sign up for VIP membership here.
Back
Top