Hi all,
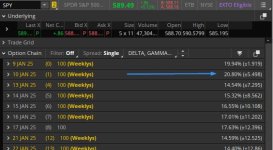
I'm trying to plot the daily expected move on my intraday chart, based yesterday's close. (What Michael Silva does at FiguringOutMoney). See the attached screenshot. For reference today is Jan 9 and the market is currently closed. It's pricing in tomorrow's IV at 20.79% or +/- 5.49pts (Jan 10). How do I get these numbers?
I tried using the imp_volatility() function and various flavors of it, but can't come up with the same numbers.
Can someone point me in the right direction?
Thanks!

