I'm trying to figure out if an option is overvalued or undervalued based on past prices and especially VS the stock's price.
I doubt I can add in a stocks price to a script that is used on an option chain screen.
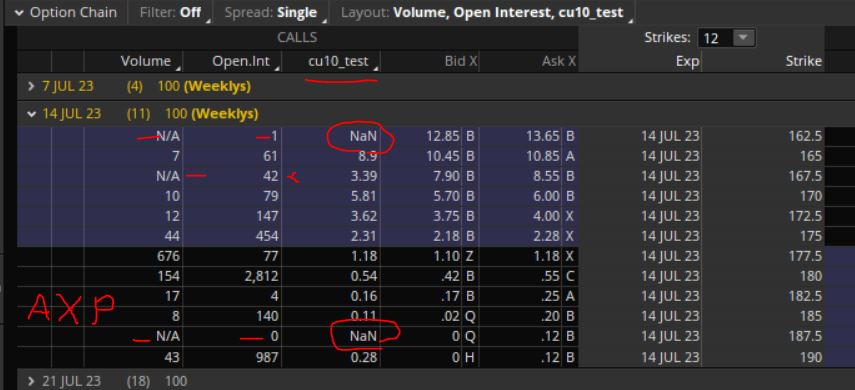
So I'm just trying to start off looking at an average but I get errors like NaN.
Is it factoring in weekend data so I need to check to make sure its NaN?
Thanks
I doubt I can add in a stocks price to a script that is used on an option chain screen.
So I'm just trying to start off looking at an average but I get errors like NaN.
Code:
def averagePrice = (close[5] + close[4] + close[3] + close[2] + close[1]) / 5.0;
plot data = averagePrice;
Is it factoring in weekend data so I need to check to make sure its NaN?
Thanks