Traders Dynamic Index (TDI) Indicator for ThinkorSwim

BenTen

Administrative
Staff member
Staff
VIP
Lifetime
The Traders Dynamic Index (TDI) is for assessing market conditions and forecasting price movements. It amalgamates trend analysis, momentum, and volatility components to offer a holistic perspective of the market.

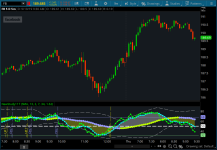
The Traders Dynamic Index (TDI) is a plot to 2 smoothed RSIs on a overbought / oversold grid with a Bollinger Band (with mid-line) of unsmoothed RSI.

The basics are that a signal occurs when the less-smoothed RSI line crosses the more-smoothed RSI line. Reversals are possible near overbought / oversold values, especially near the edges of the Bollinger Band.

Gt7zTrv.png


thinkScript Code

Code:
# LS_TradersDynamIcIndex_long
# Traders Dynamic Index  
# 2 smoothed RSIs Plotted on OverBought / OverSold Grid
# with Bollinger Band of unsmoothed RSIs

declare lower;
input averageType = {default SMA, EMA};

# RSI (Relative Strength Index)====================

input Period = 13;
def RegRSI = reference RSI(Period);

# Compute 2 smoothed (by averaging) RSIs------------------
# 2 Smoothers--------------------------------------------------------
input sm1 = 2; # 1st RSI smoother
input sm2 = 7; # 2nd RSI smoother

# 1st smoothed RSI--------------------------------------------------
# Either ----------------------------------------------------------------
# (1) a simple averaging (SMA) or -------------------------
# (2) an exponential averaging (EMA)---------------------

def smRSI1 = if averageType == averageType.SMA then Average(RegRSI, sm1 ) else ExpAverage(RegRSI, sm1);

# 2nd smoothed RSI------------------------------------------------
# Either ---------------------------------------------------------------
# (1) a simple averaging (SMA) or ---------------------
# (2) an exponential averaging (EMA)-----------------

def smRSI2 = if averageType == averageType.SMA then Average(RegRSI, sm2) else ExpAverage(RegRSI, sm2);

# So far we have:
# 1. RegRSI = RSI
# 2. smRSI1 = 1st smoothed RSI, smoother = 2
# 3. smRSI2 = 2nd smoothed RSI, smoother = 7

#--------------------------------------------------------------------------
# PLOTS---------------------------------------------------------------
#---------------------------------------------------------------------------


# RSI1---1st smoothed RSI----------------------------------------
plot RSI1 = smRSI1;
RSI1.SetDefaultColor(Color.GREEN);
RSI1.SetLineWeight(2);
RSI1.SetStyle(Curve.FIRM);
RSI1.SetPaintingStrategy(PaintingStrategy.LINE_VS_POINTS);
RSI1.HideBubble();
RSI1.HideTitle();

# RSI2---2nd smoothed RSI---------------------------------------
plot RSI2 = smRSI2;
RSI2.SetDefaultColor(Color.CYAN);
RSI2.SetLineWeight(2);
RSI2.SetStyle(Curve.FIRM);
RSI2.SetPaintingStrategy(PaintingStrategy.LINE_VS_POINTS);
RSI2.HideBubble();
RSI2.HideTitle();

#============================================
# Bollinger Bands of RSI=========================
#============================================

# Length of Bollinger Averaging---------------------------------
input BBlength = 34;          
# Width of Bollinger Band in Standard Deviations----------
input BBsdMult = 1.62;
# Mid-line for the Bollinger Band of the RegRSIs -----------

plot BBmidline = Average(RegRSI, BBlength);
BBmidline.SetDefaultColor(Color.CYAN);
BBmidline.SetLineWeight(5);
BBmidline.SetPaintingStrategy(PaintingStrategy.LINE_VS_POINTS);
BBmidline.SetStyle(Curve.FIRM);
BBmidline.HideBubble();
BBmidline.HideTitle();

BBmidline.AssignValueColor(if BBmidline < BBmidline [1] then Color.VIOLET else (if BBmidline == BBmidline [1] then Color.LIME else Color.LIME));

#--------------------------------------------------------------------------
# Upper and Lower Bollinger Bands---------------------------
#---------------------------------------------------------------------------

# Standard Deviation of unsmoothed RSIs-------------------
def SDBB = StDev(RegRSI, BBlength);

# Upper Line of Bollinger Band----------------------------------
plot uBBline = BBmidline + BBsdMult * SDBB;

uBBline.SetDefaultColor(Color.WHITE);
uBBline.SetStyle(Curve.LONG_DASH);
uBBline.SetLineWeight(1);
uBBline.HideBubble();
uBBline.HideTitle();

# Lower Line of Bollinger Band---------------------------------
plot lBBline = BBmidline - BBsdMult * SDBB;

lBBline.SetDefaultColor(Color.WHITE);
lBBline.SetStyle(Curve.LONG_DASH);
lBBline.SetLineWeight(1);
lBBline.HideBubble();
lBBline.HideTitle();

#--------------------------------------------------------------------------
# GRID-----------------------------------------------------------------
#--------------------------------------------------------------------------

plot OB = 68; # OverBought
plot ML = 50; # Mid-Line
plot OS = 32; # OverSold

OB.SetStyle(Curve.FIRM);
OB.SetDefaultColor(Color.VIOLET);
OB.SetLineWeight(1);
#OB.HideBubble();
OB.HideTitle();

ML.SetStyle(Curve.LONG_DASH);
ML.SetDefaultColor(Color.WHITE);
ML.SetLineWeight(3);
#ML.HideBubble();
ML.HideTitle();


OS.SetStyle(Curve.FIRM);
OS.SetDefaultColor(Color.LIGHT_GREEN);
OS.SetLineWeight(1);
#OS.HideBubble();
OS.HideTitle();

#---------------------------------------------------------------------------
# Add Vertical Line when RSI1 crosses BBmidline-----------
#---------------------------------------------------------------------------

AddVerticalLine (if RSI1 > BBmidline and RSI1[1] <= BBmidline
then 1 else 0, "--- UP ? ---", Color.YELLOW, Curve.LONG_DASH);

AddVerticalLine (if RSI1 < BBmidline and RSI1[1] >= BBmidline
then 1 else 0, "--- DN ? ---", Color.VIOLET, Curve.LONG_DASH);

#---------------------------------------------------------------------------
# Cloud between RSI2 and BBmidline-------------------------
#---------------------------------------------------------------------------

AddCloud (RSI2, BBmidline, Color.WHITE, Color.YELLOW);

# END ======================================

Shareable Link

https://tos.mx/xfUH6Xl
Credit:
 

Attachments

  • Gt7zTrv.png
    Gt7zTrv.png
    120.4 KB · Views: 285
Last edited by a moderator:

Join useThinkScript to post your question to a community of 21,000+ developers and traders.

I am not a coder but would love to get rid of the vertical lines with up? and dn?

@poparhon Per your request here is that same study, after removing the vertical lines specific code

Code:
# LS_TradersDynamIcIndex_long
# Traders Dynamic Index   
# 2 smoothed RSIs Plotted on OverBought / OverSold Grid
# with Bollinger Band of unsmoothed RSIs

declare lower;
input averageType = {default SMA, EMA};

# RSI (Relative Strength Index)====================

input Period = 13;
def RegRSI = reference RSI(Period);

# Compute 2 smoothed (by averaging) RSIs------------------
# 2 Smoothers--------------------------------------------------------
input sm1 = 2; # 1st RSI smoother
input sm2 = 7; # 2nd RSI smoother

# 1st smoothed RSI--------------------------------------------------
# Either ----------------------------------------------------------------
# (1) a simple averaging (SMA) or -------------------------
# (2) an exponential averaging (EMA)---------------------

def smRSI1 = if averageType == averageType.SMA then Average(RegRSI, sm1 ) else ExpAverage(RegRSI, sm1);

# 2nd smoothed RSI------------------------------------------------
# Either ---------------------------------------------------------------
# (1) a simple averaging (SMA) or ---------------------
# (2) an exponential averaging (EMA)-----------------

def smRSI2 = if averageType == averageType.SMA then Average(RegRSI, sm2) else ExpAverage(RegRSI, sm2);

# So far we have:
# 1. RegRSI = RSI
# 2. smRSI1 = 1st smoothed RSI, smoother = 2
# 3. smRSI2 = 2nd smoothed RSI, smoother = 7

#--------------------------------------------------------------------------
# PLOTS---------------------------------------------------------------
#---------------------------------------------------------------------------


# RSI1---1st smoothed RSI----------------------------------------
plot RSI1 = smRSI1;
RSI1.SetDefaultColor(Color.GREEN);
RSI1.SetLineWeight(2);
RSI1.SetStyle(Curve.FIRM);
RSI1.SetPaintingStrategy(PaintingStrategy.LINE_VS_POINTS);
RSI1.HideBubble();
RSI1.HideTitle();

# RSI2---2nd smoothed RSI---------------------------------------
plot RSI2 = smRSI2;
RSI2.SetDefaultColor(Color.CYAN);
RSI2.SetLineWeight(2);
RSI2.SetStyle(Curve.FIRM);
RSI2.SetPaintingStrategy(PaintingStrategy.LINE_VS_POINTS);
RSI2.HideBubble();
RSI2.HideTitle();

#============================================
# Bollinger Bands of RSI=========================
#============================================

# Length of Bollinger Averaging---------------------------------
input BBlength = 34;           
# Width of Bollinger Band in Standard Deviations----------
input BBsdMult = 1.62;
# Mid-line for the Bollinger Band of the RegRSIs -----------

plot BBmidline = Average(RegRSI, BBlength);
BBmidline.SetDefaultColor(Color.CYAN);
BBmidline.SetLineWeight(5);
BBmidline.SetPaintingStrategy(PaintingStrategy.LINE_VS_POINTS);
BBmidline.SetStyle(Curve.FIRM);
BBmidline.HideBubble();
BBmidline.HideTitle();

BBmidline.AssignValueColor(if BBmidline < BBmidline [1] then Color.VIOLET else (if BBmidline == BBmidline [1] then Color.LIME else Color.LIME));

#--------------------------------------------------------------------------
# Upper and Lower Bollinger Bands---------------------------
#---------------------------------------------------------------------------

# Standard Deviation of unsmoothed RSIs-------------------
def SDBB = StDev(RegRSI, BBlength);

# Upper Line of Bollinger Band----------------------------------
plot uBBline = BBmidline + BBsdMult * SDBB;

uBBline.SetDefaultColor(Color.WHITE);
uBBline.SetStyle(Curve.LONG_DASH);
uBBline.SetLineWeight(1);
uBBline.HideBubble();
uBBline.HideTitle();

# Lower Line of Bollinger Band---------------------------------
plot lBBline = BBmidline - BBsdMult * SDBB;

lBBline.SetDefaultColor(Color.WHITE);
lBBline.SetStyle(Curve.LONG_DASH);
lBBline.SetLineWeight(1);
lBBline.HideBubble();
lBBline.HideTitle();

#--------------------------------------------------------------------------
# GRID-----------------------------------------------------------------
#--------------------------------------------------------------------------

plot OB = 68; # OverBought
plot ML = 50; # Mid-Line
plot OS = 32; # OverSold

OB.SetStyle(Curve.FIRM);
OB.SetDefaultColor(Color.VIOLET);
OB.SetLineWeight(1);
#OB.HideBubble();
OB.HideTitle();

ML.SetStyle(Curve.LONG_DASH);
ML.SetDefaultColor(Color.WHITE);
ML.SetLineWeight(3);
#ML.HideBubble();
ML.HideTitle();


OS.SetStyle(Curve.FIRM);
OS.SetDefaultColor(Color.LIGHT_GREEN);
OS.SetLineWeight(1);
#OS.HideBubble();
OS.HideTitle();

#---------------------------------------------------------------------------
# Cloud between RSI2 and BBmidline-------------------------
#---------------------------------------------------------------------------

AddCloud (RSI2, BBmidline, Color.WHITE, Color.YELLOW);

# END ======================================
 
Question: I am a new member of "use think script" as of 12-17-20. Do
you use/illustrate the Trader Dynamic Index (TDI) indicator for better entry and exit?
 
Added Brake out Signals and colors for light TOS background.

TDI.jpg


Code:
# LS_TradersDynamIcIndex_long
# Traders Dynamic Index 
# 2 smoothed RSIs Plotted on OverBought / OverSold Grid
# with Bollinger Band of unsmoothed RSIs

declare lower;
input averageType = {default SMA, EMA};

# RSI (Relative Strength Index)====================

input Period = 13;
def RegRSI = reference RSI(Period);

# Compute 2 smoothed (by averaging) RSIs------------------
# 2 Smoothers--------------------------------------------------------

input sm1 = 2; # 1st RSI smoother
input sm2 = 7; # 2nd RSI smoother

# 1st smoothed RSI--------------------------------------------------
# Either ----------------------------------------------------------------
# (1) a simple averaging (SMA) or -------------------------
# (2) an exponential averaging (EMA)---------------------

def smRSI1 = if averageType == averageType.SMA then Average(RegRSI, sm1 ) else ExpAverage(RegRSI, sm1);

# 2nd smoothed RSI------------------------------------------------
# Either ---------------------------------------------------------------
# (1) a simple averaging (SMA) or ---------------------
# (2) an exponential averaging (EMA)-----------------

def smRSI2 = if averageType == averageType.SMA then Average(RegRSI, sm2) else ExpAverage(RegRSI, sm2);

# So far we have:
# 1. RegRSI = RSI
# 2. smRSI1 = 1st smoothed RSI, smoother = 2
# 3. smRSI2 = 2nd smoothed RSI, smoother = 7

#----------------------------------------------
# PLOTS---------------------------------------------------------------
#----------------------------------------------

# RSI1---1st smoothed RSI----------------------------------------
plot RSI1 = smRSI1;
RSI1.SetDefaultColor(Color.DARK_GREEN);
RSI1.SetLineWeight(3);
RSI1.SetStyle(Curve.LONG_DASH);
RSI1.SetPaintingStrategy(PaintingStrategy.LINE);
RSI1.HideBubble();
RSI1.HideTitle();

# RSI2---2nd smoothed RSI---------------------------------------
plot RSI2 = smRSI2;
RSI2.SetDefaultColor(Color.red);
RSI2.SetLineWeight(2);
RSI2.SetStyle(Curve.FIRM);
RSI2.SetPaintingStrategy(PaintingStrategy.LINE);
RSI2.HideBubble();
RSI2.HideTitle();

#----------------------------------------------
# Bollinger Bands of RSI ----------------------
#----------------------------------------------

# Length of Bollinger Averaging---------------------------------
input BBlength = 34;         
# Width of Bollinger Band in Standard Deviations----------
input BBsdMult = 1.62;
# Mid-line for the Bollinger Band of the RegRSIs -----------

plot BBmidline = Average(RegRSI, BBlength);
BBmidline.SetDefaultColor(Color.CYAN);
BBmidline.SetLineWeight(4);
BBmidline.SetPaintingStrategy(PaintingStrategy.LINE);
BBmidline.SetStyle(Curve.FIRM);
BBmidline.HideBubble();
BBmidline.HideTitle();

BBmidline.AssignValueColor(if BBmidline < BBmidline [1] then Color.bLUE else (if BBmidline == BBmidline [1] then Color.DARK_ORANGE else Color.dARK_ORANGE));

#----------------------------------------------
# Upper and Lower Bollinger Bands-------------
#----------------------------------------------

# Standard Deviation of unsmoothed RSIs-------------------
def SDBB = StDev(RegRSI, BBlength);

# Upper Line of Bollinger Band----------------------------------
plot uBBline = BBmidline + BBsdMult * SDBB;

uBBline.SetDefaultColor(Color.LIGHT_GRAY);
uBBline.SetStyle(Curve.FIRM);
uBBline.SetLineWeight(1);
uBBline.HideBubble();
uBBline.HideTitle();

# Lower Line of Bollinger Band---------------------------------
plot lBBline = BBmidline - BBsdMult * SDBB;

lBBline.SetDefaultColor(Color.LIGHT_GRAY);
lBBline.SetStyle(Curve.FIRM);
lBBline.SetLineWeight(1);
lBBline.HideBubble();
lBBline.HideTitle();

#----------------------------------------------
# GRID----------------------------------------
#----------------------------------------------

plot OB = 68; # OverBought
plot ML = 50; # Mid-Line
plot OS = 32; # OverSold

OB.SetStyle(Curve.FIRM);
OB.SetDefaultColor(Color.red);
OB.SetLineWeight(1);
#OB.HideBubble();
OB.HideTitle();

ML.SetStyle(Curve.LONG_DASH);
ML.SetDefaultColor(Color.GRAY);
ML.SetLineWeight(1);
#ML.HideBubble();
ML.HideTitle();


OS.SetStyle(Curve.FIRM);
OS.SetDefaultColor(Color.DARK_green);
OS.SetLineWeight(1);
#OS.HideBubble();
OS.HideTitle();

#----------------------------------------------
# Add Vertical Line when RSI1 crosses BBmidline-----------
#----------------------------------------------

AddVerticalLine (if RSI1 > BBmidline and RSI1[1] <= BBmidline
then 1 else 0, "--- UP ? ---", Color.ORANGE, Curve.LONG_DASH);

AddVerticalLine (if RSI1 < BBmidline and RSI1[1] >= BBmidline
then 1 else 0, "--- DN ? ---", Color.VIOLET, Curve.LONG_DASH);

#----------------------------------------------
# Cloud between RSI2 and BBmidline-------------------------
#----------------------------------------------

AddCloud (RSI2, BBmidline, Color.lIGHT_GRAY, Color.YELLOW);

#----------------------------------------------
#----------- RSI Brakeout Signal Added by Tom C.
#----------------------------------------------

input showBreakoutSignals = yes;

plot UpSignal = if RSI1 crosses above ML then ML else Double.NaN;
plot DownSignal = if RSI1 crosses below ML then ML else Double.NaN;

UpSignal.SetHiding(!showBreakoutSignals);
DownSignal.SetHiding(!showBreakoutSignals);

UpSignal.SetDefaultColor(Color.UPTICK);
UpSignal.SetPaintingStrategy(PaintingStrategy.ARROW_UP);

DownSignal.SetDefaultColor(Color.DOWNTICK);
DownSignal.SetPaintingStrategy(PaintingStrategy.ARROW_DOWN);

# END ======================================

Shareable Link​

http://tos.mx/fEdleFw
 
Last edited:
@KYLEM0990 Use the version below:

Code:
# LS_TradersDynamIcIndex_long
# Traders Dynamic Index   
# 2 smoothed RSIs Plotted on OverBought / OverSold Grid
# with Bollinger Band of unsmoothed RSIs

input averageType = {default SMA, EMA};

# RSI (Relative Strength Index)====================

input Period = 13;
def RegRSI = reference RSI(Period);

# Compute 2 smoothed (by averaging) RSIs------------------
# 2 Smoothers--------------------------------------------------------
input sm1 = 2; # 1st RSI smoother
input sm2 = 7; # 2nd RSI smoother

# 1st smoothed RSI--------------------------------------------------
# Either ----------------------------------------------------------------
# (1) a simple averaging (SMA) or -------------------------
# (2) an exponential averaging (EMA)---------------------

def smRSI1 = if averageType == averageType.SMA then Average(RegRSI, sm1 ) else ExpAverage(RegRSI, sm1);

# 2nd smoothed RSI------------------------------------------------
# Either ---------------------------------------------------------------
# (1) a simple averaging (SMA) or ---------------------
# (2) an exponential averaging (EMA)-----------------

def smRSI2 = if averageType == averageType.SMA then Average(RegRSI, sm2) else ExpAverage(RegRSI, sm2);

# So far we have:
# 1. RegRSI = RSI
# 2. smRSI1 = 1st smoothed RSI, smoother = 2
# 3. smRSI2 = 2nd smoothed RSI, smoother = 7

#--------------------------------------------------------------------------
# PLOTS---------------------------------------------------------------
#---------------------------------------------------------------------------


# RSI1---1st smoothed RSI----------------------------------------
def RSI1 = smRSI1;

# RSI2---2nd smoothed RSI---------------------------------------
def RSI2 = smRSI2;


#============================================
# Bollinger Bands of RSI=========================
#============================================

# Length of Bollinger Averaging---------------------------------
input BBlength = 34;           
# Width of Bollinger Band in Standard Deviations----------
input BBsdMult = 1.62;
# Mid-line for the Bollinger Band of the RegRSIs -----------

def BBmidline = Average(RegRSI, BBlength);

#--------------------------------------------------------------------------
# Upper and Lower Bollinger Bands---------------------------
#---------------------------------------------------------------------------

# Standard Deviation of unsmoothed RSIs-------------------
def SDBB = StDev(RegRSI, BBlength);

# Upper Line of Bollinger Band----------------------------------
def uBBline = BBmidline + BBsdMult * SDBB;

# Lower Line of Bollinger Band---------------------------------
def lBBline = BBmidline - BBsdMult * SDBB;

#--------------------------------------------------------------------------
# GRID-----------------------------------------------------------------
#--------------------------------------------------------------------------

#plot OB = 68; # OverBought
#plot ML = 50; # Mid-Line
#plot OS = 32; # OverSold

plot bullish = if RSI1 > BBmidline and RSI1[1] <= BBmidline then low else double.nan;
plot bearish = if RSI1 < BBmidline and RSI1[1] >= BBmidline then high else double.nan;

plot bull = bullish;
bull.SetPaintingStrategy(PaintingStrategy.BOOLEAN_ARROW_UP);
bull.SetDefaultColor(Color.CYAN);
bull.SetLineWeight(1);
plot bear = bearish;
bear.SetPaintingStrategy(PaintingStrategy.BOOLEAN_ARROW_DOWN);
bear.SetDefaultColor(Color.CYAN);
bear.SetLineWeight(1);

#---------------------------------------------------------------------------
# Add Vertical Line when RSI1 crosses BBmidline-----------
#---------------------------------------------------------------------------

#AddVerticalLine (if RSI1 > BBmidline and RSI1[1] <= BBmidline
#then 1 else 0, "--- UP ? ---", Color.YELLOW, Curve.LONG_DASH);

#AddVerticalLine (if RSI1 < BBmidline and RSI1[1] >= BBmidline
#then 1 else 0, "--- DN ? ---", Color.VIOLET, Curve.LONG_DASH);

#---------------------------------------------------------------------------
# Cloud between RSI2 and BBmidline-------------------------
#---------------------------------------------------------------------------

#AddCloud (RSI2, BBmidline, Color.WHITE, Color.YELLOW);

# END ======================================
 
Apologies for the bump, I was hoping if someone would be able to post the code snippet I could add to this to create an alert for the up/down signals....Greatly appreciate your help!
 
@Splinter

Code:
def bull = RSI1 > BBmidline and RSI1[1] <= BBmidline;
def bear = RSI1 < BBmidline and RSI1[1] >= BBmidline;

# Alerts
Alert(bull, " ", Alert.Bar, Sound.Chimes);
Alert(bear, " ", Alert.Bar, Sound.Bell);
 
this indicator is primarily the RSI with bollinger bands, theres ton of info on it, it calls bottoms and tops, but it also gives many false signals.
heres a simple version of it, the green is pretty much the rsi

Code:
# LS_TradersDynamIcIndex_long
# Traders Dynamic Index  
# 2 smoothed RSIs Plotted on OverBought / OverSold Grid
# with Bollinger Band of unsmoothed RSIs

declare lower;
input averageType = {default SMA, EMA};
input Period = 13;
input showBreakoutSignals = YES;

plot RegRSI = reference RSI(Period);
plot average = average(Regrsi,7);

RegRSI.SetDefaultColor(Color.GREEN);
RegRSI.SetStyle(Curve.FIRM);
RegRSI.HideBubble();
RegRSI.HideTitle();


input BBlength = 34;

input BBsdMult = 1.62;
def BBmidline = Average(RegRSI, BBlength);
def SDBB = StDev(RegRSI, BBlength);

# Upper Line of Bollinger Band----------------------------------
plot uBBline = BBmidline + BBsdMult * SDBB;

uBBline.SetDefaultColor(Color.YELLOW);
uBBline.SetStyle(Curve.SHORT_DASH);
uBBline.SetLineWeight(1);
uBBline.HideBubble();
uBBline.HideTitle();

# Lower Line of Bollinger Band---------------------------------
plot lBBline = BBmidline - BBsdMult * SDBB;

lBBline.SetDefaultColor(Color.YELLOW);
lBBline.SetStyle(Curve.SHORT_DASH);
lBBline.SetLineWeight(2);
lBBline.HideBubble();
lBBline.HideTitle();


plot UpSignal = if RegRSI crosses above lBBline then lBBline else Double.NaN;
plot DownSignal = if RegRSI crosses below uBBline then uBBline else Double.NaN;

UpSignal.SetHiding(!showBreakoutSignals);
DownSignal.SetHiding(!showBreakoutSignals);


UpSignal.SetPaintingStrategy(PaintingStrategy.ARROW_UP);
DownSignal.SetDefaultColor(Color.DOWNTICK);
DownSignal.SetPaintingStrategy(PaintingStrategy.ARROW_DOWN);
# END ======================================
 
Last edited by a moderator:
Sorry to ask again but I did not receive a response to my question. Is there a way to make the plot variables show up when I create a scan using the Condition wizard? I am looking to create a scans that identify stocks in the s&p 500 when RSI1 crosses above and below RSI2?
 
@Herbee
Click on scan.
Click on +Add filter
Click on the pencil icon next to the filter you just added
Click edit
1. In the left column, click on the pull-down window, click add study
Type in whatever you named your TDI script
2. Under Plot, click on the pull-down window, choose RSI1
3. In the middle column, choose Greater Than
4. In the right column, click on the pull-down window, click add study
Type in whatever you named your TDI script
5. Under Plot, click on the pull-down window, choose RSI2
Save
For RSI1 crossing below RSI2, create a separate scan the same way, except in the middle column choose Less Than.
HTH
XMqEWzx.png
 
if you can have a look at the picture there ,,, we have the -- Upper Volatiility band and Lower , RSI , signal Line , but the yellow line is the Base line , the base line also gives a lot of info about the trend going and more important divergences . the script you post is great similar to tradeview in all ways , but is missing online the baseline thats all , if you can add it

 
Last edited by a moderator:
all you could do is delete def bbmidline and write plot intead.

Code:
# LS_TradersDynamIcIndex_long

# Traders Dynamic Index   

# 2 smoothed RSIs Plotted on OverBought / OverSold Grid

# with Bollinger Band of unsmoothed RSIs


declare lower;

input averageType = {default SMA, EMA};

input Period = 13;

input showBreakoutSignals = YES;


plot RegRSI = reference RSI(Period);

plot average = average(Regrsi,7);


RegRSI.SetDefaultColor(Color.GREEN);

RegRSI.SetStyle(Curve.FIRM);

RegRSI.HideBubble();

RegRSI.HideTitle();


input BBlength = 34;


input BBsdMult = 1.62;

plot BBmidline = Average(RegRSI, BBlength);

def SDBB = StDev(RegRSI, BBlength);


# Upper Line of Bollinger Band----------------------------------

plot uBBline = BBmidline + BBsdMult * SDBB;


uBBline.SetDefaultColor(Color.YELLOW);

uBBline.SetStyle(Curve.SHORT_DASH);

uBBline.SetLineWeight(1);

uBBline.HideBubble();

uBBline.HideTitle();


# Lower Line of Bollinger Band---------------------------------

plot lBBline = BBmidline - BBsdMult * SDBB;


lBBline.SetDefaultColor(Color.YELLOW);

lBBline.SetStyle(Curve.SHORT_DASH);

lBBline.SetLineWeight(2);

lBBline.HideBubble();

lBBline.HideTitle();


plot UpSignal = if RegRSI crosses above lBBline then lBBline else Double.NaN;

plot DownSignal = if RegRSI crosses below uBBline then uBBline else Double.NaN;


UpSignal.SetHiding(!showBreakoutSignals);

DownSignal.SetHiding(!showBreakoutSignals);


UpSignal.SetPaintingStrategy(PaintingStrategy.ARROW_UP);

DownSignal.SetDefaultColor(Color.DOWNTICK);

DownSignal.SetPaintingStrategy(PaintingStrategy.ARROW_DOWN);

# END ======================================
 
Gt7zTrv.png


thinkScript Code

Code:
# LS_TradersDynamIcIndex_long
# Traders Dynamic Index 
# 2 smoothed RSIs Plotted on OverBought / OverSold Grid
# with Bollinger Band of unsmoothed RSIs

declare lower;
input averageType = {default SMA, EMA};

# RSI (Relative Strength Index)====================

input Period = 13;
def RegRSI = reference RSI(Period);

# Compute 2 smoothed (by averaging) RSIs------------------
# 2 Smoothers--------------------------------------------------------
input sm1 = 2; # 1st RSI smoother
input sm2 = 7; # 2nd RSI smoother

# 1st smoothed RSI--------------------------------------------------
# Either ----------------------------------------------------------------
# (1) a simple averaging (SMA) or -------------------------
# (2) an exponential averaging (EMA)---------------------

def smRSI1 = if averageType == averageType.SMA then Average(RegRSI, sm1 ) else ExpAverage(RegRSI, sm1);

# 2nd smoothed RSI------------------------------------------------
# Either ---------------------------------------------------------------
# (1) a simple averaging (SMA) or ---------------------
# (2) an exponential averaging (EMA)-----------------

def smRSI2 = if averageType == averageType.SMA then Average(RegRSI, sm2) else ExpAverage(RegRSI, sm2);

# So far we have:
# 1. RegRSI = RSI
# 2. smRSI1 = 1st smoothed RSI, smoother = 2
# 3. smRSI2 = 2nd smoothed RSI, smoother = 7

#--------------------------------------------------------------------------
# PLOTS---------------------------------------------------------------
#---------------------------------------------------------------------------


# RSI1---1st smoothed RSI----------------------------------------
plot RSI1 = smRSI1;
RSI1.SetDefaultColor(Color.GREEN);
RSI1.SetLineWeight(2);
RSI1.SetStyle(Curve.FIRM);
RSI1.SetPaintingStrategy(PaintingStrategy.LINE_VS_POINTS);
RSI1.HideBubble();
RSI1.HideTitle();

# RSI2---2nd smoothed RSI---------------------------------------
plot RSI2 = smRSI2;
RSI2.SetDefaultColor(Color.CYAN);
RSI2.SetLineWeight(2);
RSI2.SetStyle(Curve.FIRM);
RSI2.SetPaintingStrategy(PaintingStrategy.LINE_VS_POINTS);
RSI2.HideBubble();
RSI2.HideTitle();

#============================================
# Bollinger Bands of RSI=========================
#============================================

# Length of Bollinger Averaging---------------------------------
input BBlength = 34;         
# Width of Bollinger Band in Standard Deviations----------
input BBsdMult = 1.62;
# Mid-line for the Bollinger Band of the RegRSIs -----------

plot BBmidline = Average(RegRSI, BBlength);
BBmidline.SetDefaultColor(Color.CYAN);
BBmidline.SetLineWeight(5);
BBmidline.SetPaintingStrategy(PaintingStrategy.LINE_VS_POINTS);
BBmidline.SetStyle(Curve.FIRM);
BBmidline.HideBubble();
BBmidline.HideTitle();

BBmidline.AssignValueColor(if BBmidline < BBmidline [1] then Color.VIOLET else (if BBmidline == BBmidline [1] then Color.LIME else Color.LIME));

#--------------------------------------------------------------------------
# Upper and Lower Bollinger Bands---------------------------
#---------------------------------------------------------------------------

# Standard Deviation of unsmoothed RSIs-------------------
def SDBB = StDev(RegRSI, BBlength);

# Upper Line of Bollinger Band----------------------------------
plot uBBline = BBmidline + BBsdMult * SDBB;

uBBline.SetDefaultColor(Color.WHITE);
uBBline.SetStyle(Curve.LONG_DASH);
uBBline.SetLineWeight(1);
uBBline.HideBubble();
uBBline.HideTitle();

# Lower Line of Bollinger Band---------------------------------
plot lBBline = BBmidline - BBsdMult * SDBB;

lBBline.SetDefaultColor(Color.WHITE);
lBBline.SetStyle(Curve.LONG_DASH);
lBBline.SetLineWeight(1);
lBBline.HideBubble();
lBBline.HideTitle();

#--------------------------------------------------------------------------
# GRID-----------------------------------------------------------------
#--------------------------------------------------------------------------

plot OB = 68; # OverBought
plot ML = 50; # Mid-Line
plot OS = 32; # OverSold

OB.SetStyle(Curve.FIRM);
OB.SetDefaultColor(Color.VIOLET);
OB.SetLineWeight(1);
#OB.HideBubble();
OB.HideTitle();

ML.SetStyle(Curve.LONG_DASH);
ML.SetDefaultColor(Color.WHITE);
ML.SetLineWeight(3);
#ML.HideBubble();
ML.HideTitle();


OS.SetStyle(Curve.FIRM);
OS.SetDefaultColor(Color.LIGHT_GREEN);
OS.SetLineWeight(1);
#OS.HideBubble();
OS.HideTitle();

#---------------------------------------------------------------------------
# Add Vertical Line when RSI1 crosses BBmidline-----------
#---------------------------------------------------------------------------

AddVerticalLine (if RSI1 > BBmidline and RSI1[1] <= BBmidline
then 1 else 0, "--- UP ? ---", Color.YELLOW, Curve.LONG_DASH);

AddVerticalLine (if RSI1 < BBmidline and RSI1[1] >= BBmidline
then 1 else 0, "--- DN ? ---", Color.VIOLET, Curve.LONG_DASH);

#---------------------------------------------------------------------------
# Cloud between RSI2 and BBmidline-------------------------
#---------------------------------------------------------------------------

AddCloud (RSI2, BBmidline, Color.WHITE, Color.YELLOW);

# END ======================================

Shareable Link

https://tos.mx/xfUH6Xl
Credit:
Can you please add divergence lines to the TDI?
 
Last edited by a moderator:
Can you please add divergence lines to the TDI?
You might have noticed that there are quite a few scripts floating around the internet and forum that aim to identify various divergences. While their attempt is valiant, the success rates are less than stellar.

That is why, a divergence adaptation would not be a good fit for this script.
Manual chart analysis is the only tried and true method for identifying divergence. It might take a bit more effort, but it's worth it for the accuracy.
 
Last edited:
View attachment 5431

thinkScript Code

Code:
# LS_TradersDynamIcIndex_long
# Traders Dynamic Index  
# 2 smoothed RSIs Plotted on OverBought / OverSold Grid
# with Bollinger Band of unsmoothed RSIs

declare lower;
input averageType = {default SMA, EMA};

# RSI (Relative Strength Index)====================

input Period = 13;
def RegRSI = reference RSI(Period);

# Compute 2 smoothed (by averaging) RSIs------------------
# 2 Smoothers--------------------------------------------------------
input sm1 = 2; # 1st RSI smoother
input sm2 = 7; # 2nd RSI smoother

# 1st smoothed RSI--------------------------------------------------
# Either ----------------------------------------------------------------
# (1) a simple averaging (SMA) or -------------------------
# (2) an exponential averaging (EMA)---------------------

def smRSI1 = if averageType == averageType.SMA then Average(RegRSI, sm1 ) else ExpAverage(RegRSI, sm1);

# 2nd smoothed RSI------------------------------------------------
# Either ---------------------------------------------------------------
# (1) a simple averaging (SMA) or ---------------------
# (2) an exponential averaging (EMA)-----------------

def smRSI2 = if averageType == averageType.SMA then Average(RegRSI, sm2) else ExpAverage(RegRSI, sm2);

# So far we have:
# 1. RegRSI = RSI
# 2. smRSI1 = 1st smoothed RSI, smoother = 2
# 3. smRSI2 = 2nd smoothed RSI, smoother = 7

#--------------------------------------------------------------------------
# PLOTS---------------------------------------------------------------
#---------------------------------------------------------------------------


# RSI1---1st smoothed RSI----------------------------------------
plot RSI1 = smRSI1;
RSI1.SetDefaultColor(Color.GREEN);
RSI1.SetLineWeight(2);
RSI1.SetStyle(Curve.FIRM);
RSI1.SetPaintingStrategy(PaintingStrategy.LINE_VS_POINTS);
RSI1.HideBubble();
RSI1.HideTitle();

# RSI2---2nd smoothed RSI---------------------------------------
plot RSI2 = smRSI2;
RSI2.SetDefaultColor(Color.CYAN);
RSI2.SetLineWeight(2);
RSI2.SetStyle(Curve.FIRM);
RSI2.SetPaintingStrategy(PaintingStrategy.LINE_VS_POINTS);
RSI2.HideBubble();
RSI2.HideTitle();

#============================================
# Bollinger Bands of RSI=========================
#============================================

# Length of Bollinger Averaging---------------------------------
input BBlength = 34;          
# Width of Bollinger Band in Standard Deviations----------
input BBsdMult = 1.62;
# Mid-line for the Bollinger Band of the RegRSIs -----------

plot BBmidline = Average(RegRSI, BBlength);
BBmidline.SetDefaultColor(Color.CYAN);
BBmidline.SetLineWeight(5);
BBmidline.SetPaintingStrategy(PaintingStrategy.LINE_VS_POINTS);
BBmidline.SetStyle(Curve.FIRM);
BBmidline.HideBubble();
BBmidline.HideTitle();

BBmidline.AssignValueColor(if BBmidline < BBmidline [1] then Color.VIOLET else (if BBmidline == BBmidline [1] then Color.LIME else Color.LIME));

#--------------------------------------------------------------------------
# Upper and Lower Bollinger Bands---------------------------
#---------------------------------------------------------------------------

# Standard Deviation of unsmoothed RSIs-------------------
def SDBB = StDev(RegRSI, BBlength);

# Upper Line of Bollinger Band----------------------------------
plot uBBline = BBmidline + BBsdMult * SDBB;

uBBline.SetDefaultColor(Color.WHITE);
uBBline.SetStyle(Curve.LONG_DASH);
uBBline.SetLineWeight(1);
uBBline.HideBubble();
uBBline.HideTitle();

# Lower Line of Bollinger Band---------------------------------
plot lBBline = BBmidline - BBsdMult * SDBB;

lBBline.SetDefaultColor(Color.WHITE);
lBBline.SetStyle(Curve.LONG_DASH);
lBBline.SetLineWeight(1);
lBBline.HideBubble();
lBBline.HideTitle();

#--------------------------------------------------------------------------
# GRID-----------------------------------------------------------------
#--------------------------------------------------------------------------

plot OB = 68; # OverBought
plot ML = 50; # Mid-Line
plot OS = 32; # OverSold

OB.SetStyle(Curve.FIRM);
OB.SetDefaultColor(Color.VIOLET);
OB.SetLineWeight(1);
#OB.HideBubble();
OB.HideTitle();

ML.SetStyle(Curve.LONG_DASH);
ML.SetDefaultColor(Color.WHITE);
ML.SetLineWeight(3);
#ML.HideBubble();
ML.HideTitle();


OS.SetStyle(Curve.FIRM);
OS.SetDefaultColor(Color.LIGHT_GREEN);
OS.SetLineWeight(1);
#OS.HideBubble();
OS.HideTitle();

#---------------------------------------------------------------------------
# Add Vertical Line when RSI1 crosses BBmidline-----------
#---------------------------------------------------------------------------

AddVerticalLine (if RSI1 > BBmidline and RSI1[1] <= BBmidline
then 1 else 0, "--- UP ? ---", Color.YELLOW, Curve.LONG_DASH);

AddVerticalLine (if RSI1 < BBmidline and RSI1[1] >= BBmidline
then 1 else 0, "--- DN ? ---", Color.VIOLET, Curve.LONG_DASH);

#---------------------------------------------------------------------------
# Cloud between RSI2 and BBmidline-------------------------
#---------------------------------------------------------------------------

AddCloud (RSI2, BBmidline, Color.WHITE, Color.YELLOW);

# END ======================================

Shareable Link

https://tos.mx/xfUH6Xl
Credit:
very well written and useful. thanks.
 

Similar threads

Not the exact question you're looking for?

Start a new thread and receive assistance from our community.

87k+ Posts
373 Online
Create Post

Similar threads

Similar threads

The Market Trading Game Changer

Join 2,500+ subscribers inside the useThinkScript VIP Membership Club
  • Exclusive indicators
  • Proven strategies & setups
  • Private Discord community
  • ‘Buy The Dip’ signal alerts
  • Exclusive members-only content
  • Add-ons and resources
  • 1 full year of unlimited support

Frequently Asked Questions

What is useThinkScript?

useThinkScript is the #1 community of stock market investors using indicators and other tools to power their trading strategies. Traders of all skill levels use our forums to learn about scripting and indicators, help each other, and discover new ways to gain an edge in the markets.

How do I get started?

We get it. Our forum can be intimidating, if not overwhelming. With thousands of topics, tens of thousands of posts, our community has created an incredibly deep knowledge base for stock traders. No one can ever exhaust every resource provided on our site.

If you are new, or just looking for guidance, here are some helpful links to get you started.

What are the benefits of VIP Membership?
VIP members get exclusive access to these proven and tested premium indicators: Buy the Dip, Advanced Market Moves 2.0, Take Profit, and Volatility Trading Range. In addition, VIP members get access to over 50 VIP-only custom indicators, add-ons, and strategies, private VIP-only forums, private Discord channel to discuss trades and strategies in real-time, customer support, trade alerts, and much more. Learn all about VIP membership here.
How can I access the premium indicators?
To access the premium indicators, which are plug and play ready, sign up for VIP membership here.
Back
Top