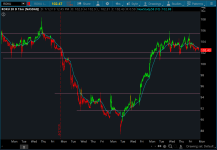
This indicator is called McGinley Dynamic for ThinkorSwim. Investopedia dubbed it "The Most Reliable Indicator You've Never Heard Of". I thought it would be interesting to share it here.
The tradition simple and exponential moving averages tend to lag. McGinley Dynamic indicator will try to overcome that by automatically adjusting itself relative to the speed of the market.
Also see an alternate version here: https://usethinkscript.com/threads/mcginley-dynamic-indicator-for-thinkorswim.338/#post-17842

read through the thread for other versions submitted being used by members
Here is the simplified version that paints your candles to the trend of the indicator.
Credits:
The tradition simple and exponential moving averages tend to lag. McGinley Dynamic indicator will try to overcome that by automatically adjusting itself relative to the speed of the market.
Also see an alternate version here: https://usethinkscript.com/threads/mcginley-dynamic-indicator-for-thinkorswim.338/#post-17842
read through the thread for other versions submitted being used by members
thinkScript Code
Code:
# McGinley Dynamic Indicator
# Mobius
# V02.11.2011
#  D = D1 + ((I - D1) / ( N * (I/D1)^4))
# where D1= yesterday's Dynamic, I = today's price, N = smoothing factor.

input value= close;
input length= 20;
input Slength = 5;
def A1= ExpAverage(value, length)[1];
def MDI = A1 + ((value - A1) / Sqr(value / A1));
plot Data = ExpAverage(MDI, Slength);
Data.SetPaintingStrategy(PaintingStrategy.LINE);
Data.SetLineWeight(2);
#Data.SetDefaultColor(GetColor(8));
def A2 = ExpAverage(value, length*3)[1];
def MDI2 = A2 + ((value - A2) / Sqr(value / A2));
plot Data2 = ExpAverage(MDI2, Slength*3);
Data2.DefineColor("Data2_SlopePos", Color.GREEN);
Data2.DefineColor("Data2_SlopeNeg", Color.MAGENTA);
Data2.AssignValueColor(if Data  > Data2 then Data2.Color("Data2_SlopePos") else Data2.Color("Data2_SlopeNeg"));
Data2.setlineweight(2);
data2.hide();
Data.DefineColor("Data_SlopePos", Color.CYAN);
Data.DefineColor("Data_SlopeNeg", Color.RED);
Data.AssignValueColor(if Data  > Data2 then Data.Color("Data_SlopePos") else Data.Color("Data_SlopeNeg"));
data.hide();
plot EMA8 = expaverage(close,8);
EMA8.setdefaultcolor(color.DARK_ORANGE);
EMA8.setlineweight(2);
EMA8.hide();
# End Code ------------
def buySignal = if Data > Data2 and Data[1] <= Data2[1] and expaverage(close,8) > average(close,13) then 1 else 0;
def sellSignal = if Data < Data2 and Data[1] >= Data2[1] and expaverage(close,85) < average(close,13) then 1 else 0;
plot signal = if buySignal or sellSignal then Data else double.nan;
signal.assignValueColor(if buySignal then color.WHITE else color.YELLOW);
signal.setLineWeight(5);
#signal.SetStyle(curve.points);
signal.setpaintingstrategy(paintingStrategy.SQUARES);

# additional plots from yahoo forum
input price = close;
input length2 = 14;
input displace = 0;
plot WS = WildersAverage(price[-displace], length2);
WS.setDefaultColor(GetColor(8));
input periods = 10;
rec _md = compoundValue( 1, _md[1] + (( close - _md[1] ) / ( periods *
power( close / _md[1], 4 ) ) ), close );
plot MD = _md;
MD.setdefaultcolor(color.CYAN);
MD.setlineweight(2);
MD.hide();

def buySignal2 = if MD > WS and MD[1] <= WS[1] and expaverage(close,8) > average(close,13) then 1 else 0;
def sellSignal2 = if MD < WS and MD[1] >= WS[1] and expaverage(close,85) < average(close,13) then 1 else 0;
plot signal2 = if buySignal2 or sellSignal2 then MD else double.nan;
signal2.assignValueColor(if buySignal2 then color.WHITE else color.YELLOW);
signal2.setLineWeight(5);
signal2.SetStyle(curve.points);
#signal2.setpaintingstrategy(paintingStrategy.SQUARES);
Here is the simplified version that paints your candles to the trend of the indicator.
Code:
#McGinleyIndicator
declare upper;

input periods = 10;

rec _md = CompoundValue( 1, _md[1] + (( close - _md[1] ) / ( periods * Power( close / _md[1], 4 ) ) ), close );

plot MD = _md;
AssignPriceColor(if MD > MD[1] then Color.GREEN else Color.RED);
Shareable Link
https://tos.mx/XqTZTfCredits:
- Mobius
- Greg Schroeder
Attachments
Last edited by a moderator:


