Upper Code created by me based on the lower code.
Author Message:
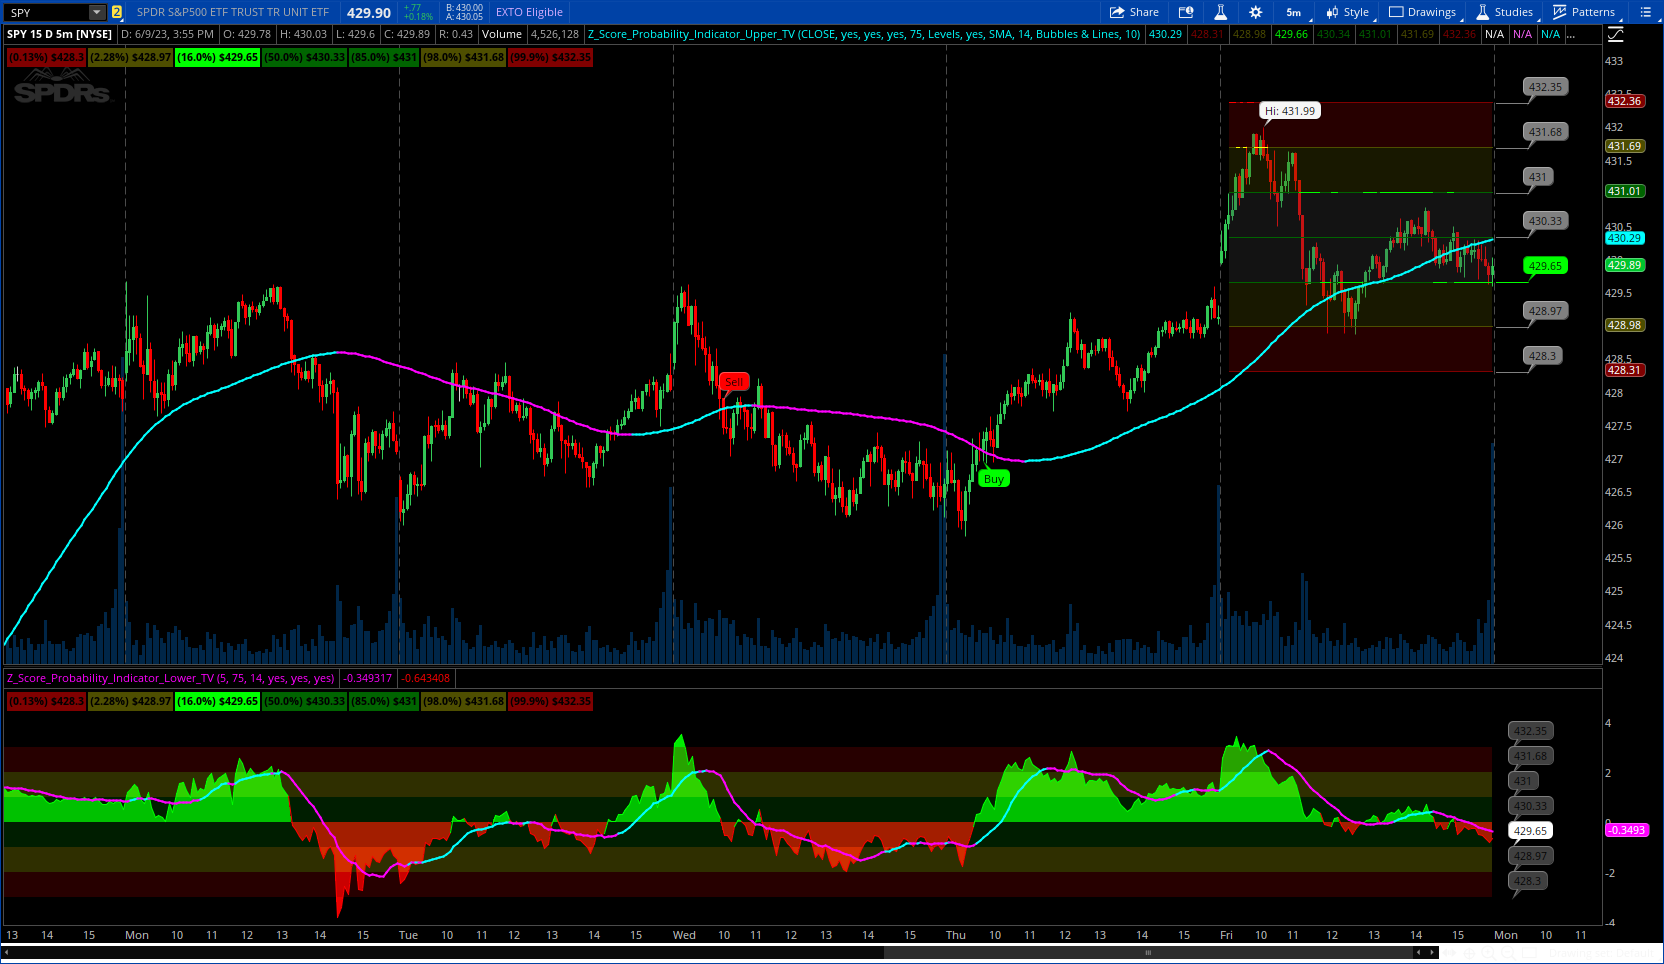
This is the Z-Score Probability indicator. As many people like my original Z-Score indicator and have expressed more interest in the powers of the Z, I decided to make this indicator which shows additional powers of the Z-Score.
Z-Score is not only useful for measuring a ticker or any other variable’s distance from the mean, it is also useful to calculate general probability in a normal distribution set. Not only can it calculate probability in a dataset, but it can also calculate the variables within said dataset by using the Standard Deviation and the Mean of the dataset.
Using these 2 aspects of the Z-Score, you can, In principle, have an indicator that operates similar to Fibonacci retracement levels with the added bonus of being able to actually ascertain the realistic probability of said retracement.
more details: https://www.tradingview.com/script/zrc6tWT4-Z-Score-Probability-Indicator/
Upper CODE:
CSS:
# creatred by Sam4Cok@Samer800 based on © Steversteves code
#https://www.tradingview.com/v/zrc6tWT4/
#// © Steversteves
#indicator("Z-Score Probability Indicator")

input source = close;
input showLabel       = yes;        # "Show Z-Table"
input HighlightLevels = yes;
input ShowSignals     = yes;
input LookbackLength     = 75;         # "Lookback Length"
input chartStyle         = {Default "Levels", "Band", "Levels & Band", "Don't Show"};
input showMovAvgLine     = yes;        # "Show SMA"
input movAvgType         = {default SMA, EMA, WMA, HullMA, VWMA, RMA, TEMA};
input movAvgLength       = 14;         # "SMA Length"
input onChartPriceProbaiblity = {"Bubbles", "Lines",Default "Bubbles & Lines", "Don't Show"};
input priceBubbleLocatation = 5;


def na = Double.NaN;
def n = priceBubbleLocatation;
def last = isNaN(close);
def loc = last[n] and !last[n+1];
def lines = chartStyle==chartStyle."Levels" or chartStyle==chartStyle."Levels & Band";
def band  = chartStyle==chartStyle."Band" or chartStyle==chartStyle."Levels & Band";
def propLines = onChartPriceProbaiblity==onChartPriceProbaiblity."Lines" or
                onChartPriceProbaiblity==onChartPriceProbaiblity."Bubbles & Lines";
def propBubbles = onChartPriceProbaiblity==onChartPriceProbaiblity."Bubbles" or
                  onChartPriceProbaiblity==onChartPriceProbaiblity."Bubbles & Lines";
#get_ma(src, ma_type, len) =>
script get_ma {
    input ma_type = "TEMA";
    input src = close;
    input len = 100;
    def hullma = HullMovingAvg(src, len);
    def vwma = Average(src * volume, len) / Average(volume, len);
    def ema1 = ExpAverage(src, len);
    def ema2 = ExpAverage(ema1, len);
    def ema3 = ExpAverage(ema2, len);
    def tema = 3 * (ema1 - ema2) + ema3;
    def ma = if ma_type == "SMA" then Average(src, len) else
        if ma_type == "EMA" then ExpAverage(src, len)   else
            if ma_type == "WMA" then WMA(src, len) else
                if ma_type == "HullMA" then hullma else
                    if ma_type == "VWMA" then vwma else
                        if ma_type == "RMA" then WildersAverage(src, len) else tema;
    plot out = ma;
}
def cl_sma = Average(source, LookbackLength);
def cl_sd = StDev(source, LookbackLength);
def z = (source - cl_sma) / cl_sd;

#// Logical Assessments ///
def "0"  = 0;
def "1"  = 1;
def "2"  = 2;
def "3"  = 3;
def "-1" = -1;
def "-2" = -2;
def "-3" = -3;

def negThree = z < "-3";
def negTwo   = z <= "-2" and z >= "-3";
def negOne   = z <  "0" and z > "-1";
def zero     = z >= "1" and z <= "-1";
def posOne   = z >= "0" and z < "1";
def posTwo   = z >= "2" and z <= "3";
def posThree = z > "3";

#/// Price Level Calculations ///
def bar_index = AbsValue(CompoundValue(1, BarNumber(), 0));
#def loc = ShowPriceProbaiblity and last and !last[1];
def neutral_price = (cl_sma) + ("0" * cl_sd);
def onesd_price = (cl_sma) + ("1" * cl_sd);
def twosd_price = (cl_sma) + ("2" * cl_sd);
def threesd_price = (cl_sma) + ("3" * cl_sd);
def neg_onesd_price = (cl_sma) + ("-1" * cl_sd);
def neg_twosd_price = (cl_sma) + ("-2" * cl_sd);
def neg_threesd_price = (cl_sma) + ("-3" * cl_sd);

def zero1;
def posOne1;
def posTwo1;
def posThree1;
def negOne1;
def negTwo1;
def negThree1;

if bar_index >= LookbackLength {
    negThree1 = neg_threesd_price;
    negTwo1   = neg_twosd_price;
    negOne1   = neg_onesd_price;
    zero1     = neutral_price;
    posOne1   = onesd_price;
    posTwo1   = twosd_price;
    posThree1 = threesd_price;
    } else {
    zero1     = na;
    posOne1   = na;
    posTwo1   = na;
    posThree1 = na;
    negOne1   = na;
    negTwo1   = na;
    negThree1 = na;
}
def zsma = get_ma(movAvgType, zero1, movAvgLength);
def z_sma = if showMovAvgLine then zsma else na;
def falling = zsma <= lowest(zsma, 3);
def rising  = zsma >= highest(zsma,3);

plot avgZscore = z_sma;
avgZscore.AssignValueColor(if rising then Color.CYAN else Color.MAGENTA);
avgZscore.SetLineWeight(2);

def negThree11 = inertiaAll(highestAll(inertiaAll(negThree1, 2)), LookbackLength+1);
def negTwo11   = inertiaAll(highestAll(inertiaAll(negTwo1, 2)), LookbackLength+1);
def negOne11   = inertiaAll(highestAll(inertiaAll(negOne1, 2)), LookbackLength+1);
def zero11     = inertiaAll(highestAll(inertiaAll(zero1, 2)), LookbackLength+1);
def one11      = inertiaAll(highestAll(inertiaAll(posOne1, 2)), LookbackLength+1);
def two11      = inertiaAll(highestAll(inertiaAll(posTwo1, 2)), LookbackLength+1);
def three11    = inertiaAll(highestAll(inertiaAll(posThree1, 2)), LookbackLength+1);

#-- Lines
plot negThree_22 = if lines then negThree11 else na;
plot negTwo_22   = if lines then negTwo11 else na;
plot negOne_22   = if lines then negOne11 else na;
plot zero_22     = if lines then zero11 else na;
plot posOne_22      = if lines then one11  else na;
plot two_22      = if lines then two11  else na;
plot three_22    = if lines then three11 else na;

negThree_22.AssignValueColor(if negThree then Color.RED else Color.DARK_RED);
negTwo_22.AssignValueColor(if negTwo then Color.YELLOW else CreateColor(78,78,0));
negOne_22.AssignValueColor(if negOne then Color.GREEN else Color.DARK_GREEN);
zero_22.AssignValueColor(if zero then Color.GREEN else Color.DARK_GREEN);
posOne_22.AssignValueColor(if posOne then Color.GREEN else Color.DARK_GREEN);
two_22.AssignValueColor(if posTwo then Color.YELLOW else CreateColor(78,78,0));
three_22.AssignValueColor(if posThree then Color.RED else Color.DARK_RED);
#--- Band
plot negThree22 = if band then negThree1 else na;
plot negTwo22   = if band then negTwo1 else na;
plot negOne22   = if band then negOne1 else na;
plot zero22     = if band then zero1 else na;
plot one22      = if band then posone1  else na;
plot two22      = if band then postwo1  else na;
plot three22    = if band then posthree1 else na;

negThree22.AssignValueColor(if negThree then Color.RED else Color.DARK_RED);
negTwo22.AssignValueColor(if negTwo then Color.YELLOW else CreateColor(78,78,0));
negOne22.AssignValueColor(if negOne then Color.GREEN else Color.DARK_GREEN);
zero22.AssignValueColor(if zero then Color.GREEN else Color.DARK_GREEN);
one22.AssignValueColor(if posOne then Color.GREEN else Color.DARK_GREEN);
two22.AssignValueColor(if posTwo then Color.YELLOW else CreateColor(78,78,0));
three22.AssignValueColor(if posThree then Color.RED else Color.DARK_RED);
#--

plot negThree_2 = if negThree then negThree22 else na;
plot negTwo_2   = if negTwo then negTwo22 else na;
plot negOne_2   = if negOne then negOne22 else na;
plot zero_2     = if zero then zero22 else na;
plot posOne_2   = if posOne then one22  else na;
plot posTwo_2   = if posTwo then two22  else na;
plot posThree_2 = if posThree then three22 else na;

negThree_2.SetDefaultColor(Color.RED);
negTwo_2.SetDefaultColor(Color.YELLOW);
negOne_2.SetDefaultColor(Color.GREEN);
zero_2.SetDefaultColor(Color.GREEN);
posone_2.SetDefaultColor(Color.GREEN);
postwo_2.SetDefaultColor(Color.YELLOW);
posthree_2.SetDefaultColor(Color.RED);

negThree_2.SetLineWeight(2);
negTwo_2.SetLineWeight(2);
negOne_2.SetLineWeight(2);
zero_2.SetLineWeight(2);
posone_2.SetLineWeight(2);
postwo_2.SetLineWeight(2);
posthree_2.SetLineWeight(2);

def negThree33 = if last then na else negThree1;
def negTwo33   = if last then na else negTwo1;
def negOne33   = if last then na else negOne1;
def zero33     = if last then na else zero1;
def posOne33   = if last then na else posOne1;
def posTwo33   = if last then na else posTwo1;
def posThree33 = if last then na else posThree1;

def negThree3 = CompoundValue(1, if IsNaN(negThree33) then negThree3[1] else negThree1, negThree1);
def negTwo3   = CompoundValue(1, if IsNaN(negTwo33)   then negTwo3[1]   else negTwo1, negTwo1);
def negOne3   = CompoundValue(1, if IsNaN(negOne33)   then negOne3[1]   else negOne1, negOne1);
def zero3     = CompoundValue(1, if IsNaN(zero33)     then zero3[1]     else zero1, zero1);
def posOne3   = CompoundValue(1, if IsNaN(posOne33)   then posOne3[1]   else posOne1, posOne1);
def posTwo3   = CompoundValue(1, if IsNaN(posTwo33)   then posTwo3[1]   else posTwo1, posTwo1);
def posThree3 = CompoundValue(1, if IsNaN(posThree33) then posThree3[1] else posThree1, posThree1);


plot negThree_3 = if !last or last[n] then na else negThree3;
plot negTwo_3   = if !last or last[n] then na else negTwo3;
plot negOne_3   = if !last or last[n] then na else negOne3;
plot zero_3     = if !last or last[n] then na else zero3;
plot posOne_3   = if !last or last[n] then na else posOne3;
plot posTwo_3   = if !last or last[n] then na else posTwo3;
plot posThree_3 = if !last or last[n] then na else posThree3;

negThree_3.AssignValueColor(if negThree[n] then Color.RED else Color.GRAY);
negTwo_3.AssignValueColor(if negTwo[n] then Color.YELLOW else Color.GRAY);
negOne_3.AssignValueColor(if negOne[n] then Color.GREEN else Color.GRAY);
zero_3.AssignValueColor(if zero[n] then Color.GREEN else Color.GRAY);
posone_3.AssignValueColor(if posone[n] then Color.GREEN else Color.GRAY);
postwo_3.AssignValueColor(if postwo[n] then Color.YELLOW else Color.GRAY);
posthree_3.AssignValueColor(if posthree[n] then Color.RED else Color.GRAY);

negThree_3.SetHiding(!propLines);
negTwo_3.SetHiding(!propLines);
negOne_3.SetHiding(!propLines);
zero_3.SetHiding(!propLines);
posone_3.SetHiding(!propLines);
postwo_3.SetHiding(!propLines);
posthree_3.SetHiding(!propLines);
#-- Label

Addlabel(showLabel, "(0.13%) $" + Round(negThree1,2), if negThree then Color.RED else Color.DARK_RED);
Addlabel(showLabel, "(2.28%) $" + Round(negTwo1,2), if negTwo then Color.YELLOW else CreateColor(78,78,0));
Addlabel(showLabel, "(16.0%) $" + Round(negOne1,2), if negOne then Color.GREEN else Color.DARK_GREEN);
Addlabel(showLabel, "(50.0%) $" + Round(zero1,2), if zero then Color.GREEN else Color.DARK_GREEN);
Addlabel(showLabel, "(85.0%) $" + Round(posOne1,2), if posOne then Color.GREEN else Color.DARK_GREEN);
Addlabel(showLabel, "(98.0%) $" + Round(posTwo1,2), if posTwo then Color.YELLOW else CreateColor(78,78,0));
Addlabel(showLabel, "(99.9%) $" + Round(posThree1,2), if posThree then Color.RED else Color.DARK_RED);

# -- Bubbles
AddChartBubble(negThree_3 and negThree_3[n-1] and propBubbles, negThree_3 ,round(negThree1[n],2),
              if negThree[n] then Color.RED else Color.GRAY, yes);
AddChartBubble(negTwo_3   and negTwo_3[n-1]  and propBubbles, negTwo_3   ,round(negTwo1[n],2),
              if negTwo[n] then Color.YELLOW else Color.GRAY, yes);
AddChartBubble(negOne_3   and negOne_3[n-1]  and propBubbles, negOne_3   ,round(negOne1[n],2),
              if negOne[n] then Color.GREEN else color.GRAY, yes);
AddChartBubble(zero_3     and zero_3[n-1]    and propBubbles, zero_3     ,round(zero1[n],2),
              if zero[n] then Color.GREEN else Color.GRAY, yes);
AddChartBubble(posOne_3   and posOne_3[n-1]  and propBubbles, posOne_3   ,round(posOne1[n],2),
              if posOne[n] then Color.GREEN else Color.GRAY, yes);
AddChartBubble(posTwo_3   and posTwo_3[n-1]  and propBubbles, posTwo_3   ,round(posTwo1[n],2),
              if posTwo[n] then Color.YELLOW else Color.GRAY, yes);
AddChartBubble(posThree_3 and posThree_3[n-1] and propBubbles, posThree_3 ,round(posThree1[n],2),
              if posThree[n] then Color.RED else Color.GRAY, yes);

#-- Clouds
#HighlightLevels
AddCloud(if !HighlightLevels then na else three22, two22, Color.DARK_RED);
AddCloud(if !HighlightLevels then na else two22, one22, CreateColor(78,78,0));
AddCloud(if !HighlightLevels then na else one22, negOne22, Color.DARK_GRAY);
AddCloud(if !HighlightLevels then na else negOne22, negTwo22, CreateColor(78,78,0));
AddCloud(if !HighlightLevels then na else negTwo22, negThree22, Color.DARK_RED);

AddCloud(if !HighlightLevels then na else three_22, two_22, Color.DARK_RED);
AddCloud(if !HighlightLevels then na else two_22, posOne_22, CreateColor(78,78,0));
AddCloud(if !HighlightLevels then na else posOne_22, negOne_22, Color.DARK_GRAY);
AddCloud(if !HighlightLevels then na else negOne_22, negTwo_22, CreateColor(78,78,0));
AddCloud(if !HighlightLevels then na else negTwo_22, negThree_22, Color.DARK_RED);

#-- Signals
def zRising  = z >= highest(average(z, 5), 5);
def zFalling = z <= lowest(average(z, 5), 5);

def sigUp = (source crosses above zsma) and zRising and z>0.5;
def sigDn = (source crosses below zsma) and zFalling and z<-0.5;

AddChartBubble(ShowSignals and sigUp, low, "Buy", Color.GREEN, no);
AddChartBubble(ShowSignals and sigDn, high, "Sell", Color.RED, yes);

#END of CODE
LOWER CODE:
CSS:
#// © Steversteves
#indicator("Z-Score Probability Indicator")
#t1 = "Determines the Length of Z-Score Assessment. Defaults to a 75 lookback period"
#t2 = "Determines the length of the SMA if the user selects Show SMA. Default is 75, but for a more responsive SMA you can reduce it to 14. Optional."
#Converted by sam4Cok@Samer800    - 06/2023

declare lower;
input priceBubbleLocatation = 5;
input LookbackLength  = 75;         # "Lookback Length" tip: t1
input smaLength       = 14;         # "SMA Length"      tip: t2
input ShowPriceBubble = yes;        # "Distribution Probaiblity Price"
input showLabel       = yes;        # "Show Z-Table"
input showSmaLine     = yes;        # "Show SMA"

def na = Double.NaN;
def last = isNaN(close);
def n = priceBubbleLocatation;
def bar_index = AbsValue(CompoundValue(1, BarNumber(), 0));
def loc = ShowPriceBubble and last[n] and !last[n+1];


def cl_sma = Average(close, LookbackLength);
def cl_sd = StDev(close, LookbackLength);
def z = (close - cl_sma) / cl_sd;
def zsma = Average(z, smaLength);
def z_sma = if showSmaLine then zsma else na;

#// Logical Assessments ///

def zero_one = z >= 0 and z < 1;
def two_three = z >= 2 and z < 3.01;
def three = z >= 3;
def zero = z >= 0.99 and z <= -0.99;
def neg_zero_one = z < 0 and z > -1;
def neg_two_three = z <= -2 and z > -3;
def neg_three = z <= -3;
#def falling = z_sma < lowest(z_sma, 3);
def rising = z_sma >= highest(z_sma, smaLength);

#/// Plots ///
plot sma_Z = z_sma;    # "Z-SMA"
plot Z_Score = z;      # "Z-Score"
Z_Score.AssignValueColor(if z>0 then Color.GREEN else Color.RED);
sma_Z.AssignValueColor(if rising then Color.CYAN else Color.MAGENTA);
sma_Z.SetLineWeight(2);

def neutral = 0;
def onesd = 1;
def twosd = 2;
def threesd = 3;
def neg_onesd = -1;
def neg_twosd = -2;
def neg_threesd = -3;

AddCloud(Z_Score, neutral, Color.GREEN, Color.RED);
AddCloud(Z_Score, neutral, Color.GREEN, Color.RED);
AddCloud(Z_Score, neutral, Color.GREEN, Color.RED);
AddCloud(Z_Score, neutral, Color.GREEN, Color.RED);
AddCloud(Z_Score, neutral, Color.GREEN, Color.RED);
AddCloud(Z_Score, neutral, Color.GREEN, Color.RED);
AddCloud(Z_Score, neutral, Color.GREEN, Color.RED);

AddCloud(if last then na else threesd, twosd        , Color.DARK_RED);
AddCloud(if last then na else twosd, onesd          , CreateColor(157,157,0));
AddCloud(if last then na else onesd, neg_onesd      , Color.DARK_GREEN);
AddCloud(if last then na else neg_onesd, neg_twosd  , CreateColor(157,157,0));
AddCloud(if last then na else neg_twosd, neg_threesd, Color.DARK_RED);

#/// Price Level Calculations ///
def neutral_price = (cl_sma) + (0 * cl_sd);
def onesd_price = (cl_sma) + (1 * cl_sd);
def twosd_price = (cl_sma) + (2 * cl_sd);
def threesd_price = (cl_sma) + (3 * cl_sd);
def neg_onesd_price = (cl_sma) + (-1 * cl_sd);
def neg_twosd_price = (cl_sma) + (-2 * cl_sd);
def neg_threesd_price = (cl_sma) + (-3 * cl_sd);

def zero1;
def one;
def two;
def three1;
def negOne;
def negTwo;
def negThree;

if bar_index >= 75 {
    zero1 = neutral_price;
    one = onesd_price;
    two = twosd_price;
    three1 = threesd_price;
    negOne = neg_onesd_price;
    negTwo = neg_twosd_price;
    negThree = neg_threesd_price;
    } else {
    zero1 = na;
    one = na;
    two = na;
    three1 = na;
    negOne = na;
    negTwo = na;
    negThree = na;
}

AddChartBubble(loc, neutral  , round(zero1[n+1],2), if zero[n+1] then Color.WHITE else Color.DARK_GRAY, yes);
AddChartBubble(loc, onesd    , round(one[n+1],2), if zero_one[n+1] then Color.WHITE else Color.DARK_GRAY, yes);
AddChartBubble(loc, twosd    , round(two[n+1],2), if two_three[n+1] then Color.WHITE else Color.DARK_GRAY, yes);
AddChartBubble(loc, threesd  , round(three1[n+1],2), if three[n+1] then Color.WHITE else Color.DARK_GRAY, yes);
AddChartBubble(loc, neg_onesd, round(negOne[n+1],2), if neg_zero_one[n+1] then Color.WHITE else Color.DARK_GRAY, yes);
AddChartBubble(loc, neg_twosd, round(negTwo[n+1],2), if neg_two_three[n+1] then Color.WHITE else Color.DARK_GRAY, yes);
AddChartBubble(loc, neg_threesd, round(negThree[n+1],2), if neg_three[n+1] then Color.WHITE else Color.DARK_GRAY, yes);

#-- Label

Addlabel(showLabel, "(0.13%) $" + round(negThree,2), if neg_three then Color.RED else Color.DARK_RED);
Addlabel(showLabel, "(2.28%) $" + round(negTwo,2), if neg_two_three then Color.YELLOW else CreateColor(78,78,0));
Addlabel(showLabel, "(16.0%) $" + round(negOne,2), if neg_zero_one then Color.GREEN else Color.DARK_GREEN);
Addlabel(showLabel, "(50.0%) $" + round(zero1,2), if zero then Color.GREEN else Color.DARK_GREEN);
Addlabel(showLabel, "(85.0%) $" + round(one,2), if zero_one then Color.GREEN else Color.DARK_GREEN);
Addlabel(showLabel, "(98.0%) $" + round(two,2), if two_three then Color.YELLOW else CreateColor(78,78,0));
Addlabel(showLabel, "(99.9%) $" + round(three1,2), if three then Color.RED else Color.DARK_RED);


#END of CODE
") thank you much
thank you much