# creatred by Sam4Cok@Samer800 based on © Steversteves code
#https://www.tradingview.com/v/zrc6tWT4/
#// © Steversteves
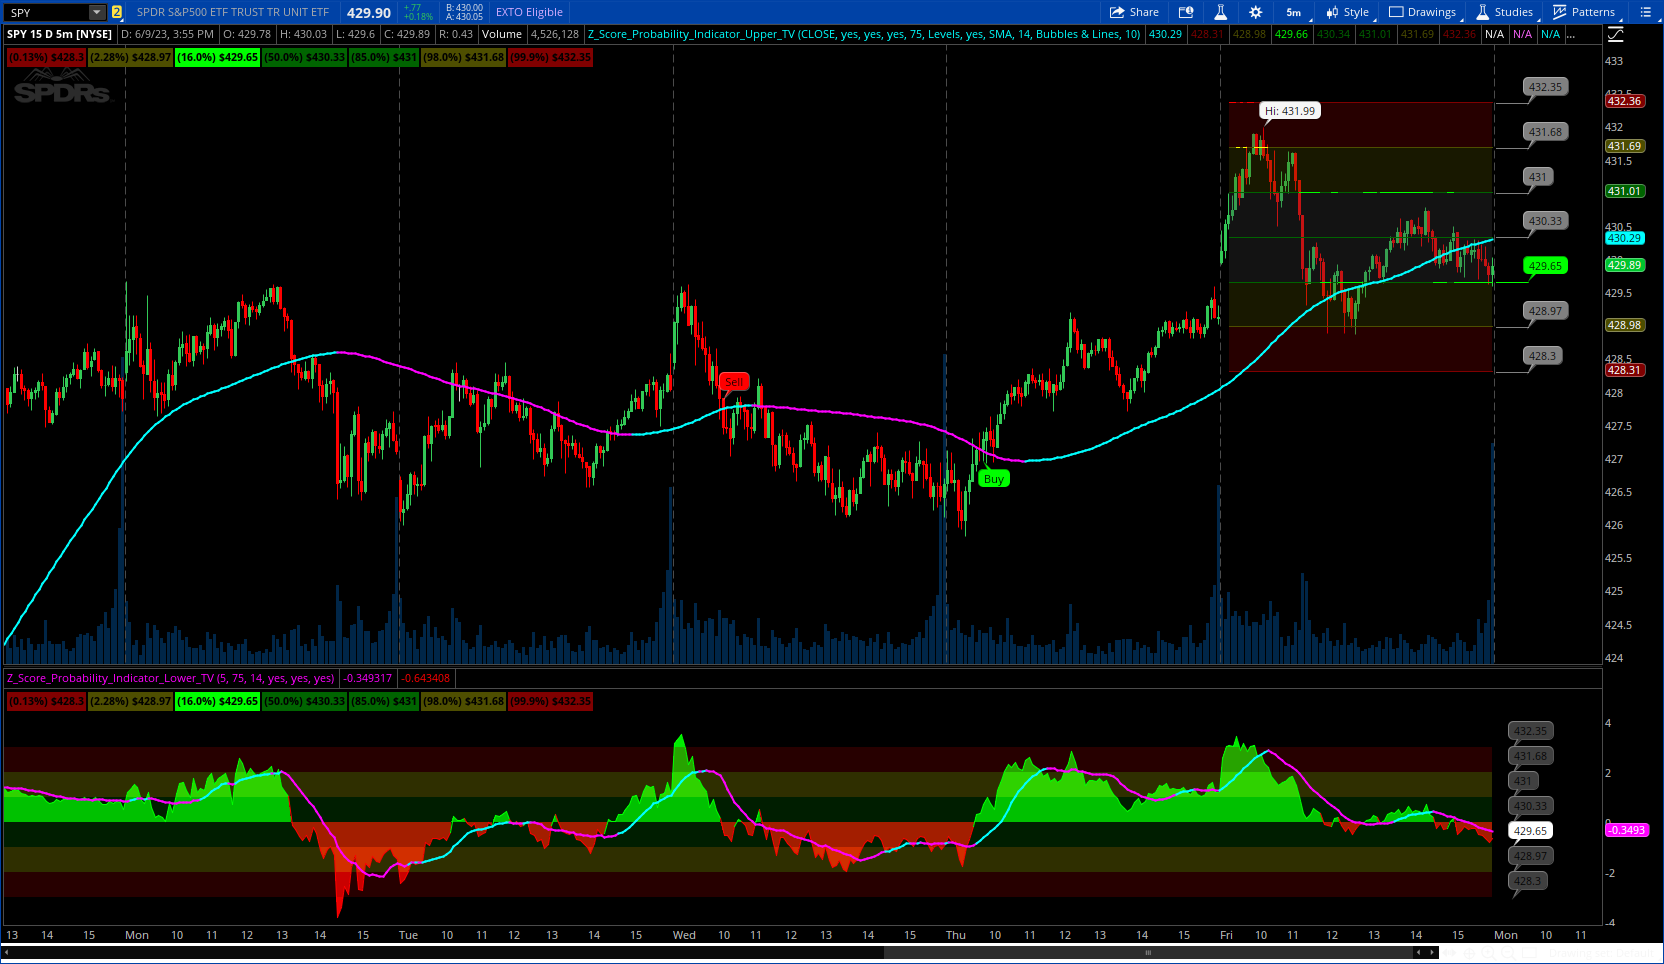
#indicator("Z-Score Probability Indicator")
input source = close;
input showLabel = yes; # "Show Z-Table"
input HighlightLevels = yes;
input ShowSignals = yes;
input LookbackLength = 75; # "Lookback Length"
input chartStyle = {Default "Levels", "Band", "Levels & Band", "Don't Show"};
input showMovAvgLine = yes; # "Show SMA"
input movAvgType = {default SMA, EMA, WMA, HullMA, VWMA, RMA, TEMA};
input movAvgLength = 14; # "SMA Length"
input onChartPriceProbaiblity = {"Bubbles", "Lines",Default "Bubbles & Lines", "Don't Show"};
input priceBubbleLocatation = 5;
def na = Double.NaN;
def n = priceBubbleLocatation;
def last = isNaN(close);
def loc = last[n] and !last[n+1];
def lines = chartStyle==chartStyle."Levels" or chartStyle==chartStyle."Levels & Band";
def band = chartStyle==chartStyle."Band" or chartStyle==chartStyle."Levels & Band";
def propLines = onChartPriceProbaiblity==onChartPriceProbaiblity."Lines" or
onChartPriceProbaiblity==onChartPriceProbaiblity."Bubbles & Lines";
def propBubbles = onChartPriceProbaiblity==onChartPriceProbaiblity."Bubbles" or
onChartPriceProbaiblity==onChartPriceProbaiblity."Bubbles & Lines";
#get_ma(src, ma_type, len) =>
script get_ma {
input ma_type = "TEMA";
input src = close;
input len = 100;
def hullma = HullMovingAvg(src, len);
def vwma = Average(src * volume, len) / Average(volume, len);
def ema1 = ExpAverage(src, len);
def ema2 = ExpAverage(ema1, len);
def ema3 = ExpAverage(ema2, len);
def tema = 3 * (ema1 - ema2) + ema3;
def ma = if ma_type == "SMA" then Average(src, len) else
if ma_type == "EMA" then ExpAverage(src, len) else
if ma_type == "WMA" then WMA(src, len) else
if ma_type == "HullMA" then hullma else
if ma_type == "VWMA" then vwma else
if ma_type == "RMA" then WildersAverage(src, len) else tema;
plot out = ma;
}
def cl_sma = Average(source, LookbackLength);
def cl_sd = StDev(source, LookbackLength);
def z = (source - cl_sma) / cl_sd;
#// Logical Assessments ///
def "0" = 0;
def "1" = 1;
def "2" = 2;
def "3" = 3;
def "-1" = -1;
def "-2" = -2;
def "-3" = -3;
def negThree = z < "-3";
def negTwo = z <= "-2" and z >= "-3";
def negOne = z < "0" and z > "-1";
def zero = z >= "1" and z <= "-1";
def posOne = z >= "0" and z < "1";
def posTwo = z >= "2" and z <= "3";
def posThree = z > "3";
#/// Price Level Calculations ///
def bar_index = AbsValue(CompoundValue(1, BarNumber(), 0));
#def loc = ShowPriceProbaiblity and last and !last[1];
def neutral_price = (cl_sma) + ("0" * cl_sd);
def onesd_price = (cl_sma) + ("1" * cl_sd);
def twosd_price = (cl_sma) + ("2" * cl_sd);
def threesd_price = (cl_sma) + ("3" * cl_sd);
def neg_onesd_price = (cl_sma) + ("-1" * cl_sd);
def neg_twosd_price = (cl_sma) + ("-2" * cl_sd);
def neg_threesd_price = (cl_sma) + ("-3" * cl_sd);
def zero1;
def posOne1;
def posTwo1;
def posThree1;
def negOne1;
def negTwo1;
def negThree1;
if bar_index >= LookbackLength {
negThree1 = neg_threesd_price;
negTwo1 = neg_twosd_price;
negOne1 = neg_onesd_price;
zero1 = neutral_price;
posOne1 = onesd_price;
posTwo1 = twosd_price;
posThree1 = threesd_price;
} else {
zero1 = na;
posOne1 = na;
posTwo1 = na;
posThree1 = na;
negOne1 = na;
negTwo1 = na;
negThree1 = na;
}
def zsma = get_ma(movAvgType, zero1, movAvgLength);
def z_sma = if showMovAvgLine then zsma else na;
def falling = zsma <= lowest(zsma, 3);
def rising = zsma >= highest(zsma,3);
plot avgZscore = z_sma;
avgZscore.AssignValueColor(if rising then Color.CYAN else Color.MAGENTA);
avgZscore.SetLineWeight(2);
def negThree11 = inertiaAll(highestAll(inertiaAll(negThree1, 2)), LookbackLength+1);
def negTwo11 = inertiaAll(highestAll(inertiaAll(negTwo1, 2)), LookbackLength+1);
def negOne11 = inertiaAll(highestAll(inertiaAll(negOne1, 2)), LookbackLength+1);
def zero11 = inertiaAll(highestAll(inertiaAll(zero1, 2)), LookbackLength+1);
def one11 = inertiaAll(highestAll(inertiaAll(posOne1, 2)), LookbackLength+1);
def two11 = inertiaAll(highestAll(inertiaAll(posTwo1, 2)), LookbackLength+1);
def three11 = inertiaAll(highestAll(inertiaAll(posThree1, 2)), LookbackLength+1);
#-- Lines
plot negThree_22 = if lines then negThree11 else na;
plot negTwo_22 = if lines then negTwo11 else na;
plot negOne_22 = if lines then negOne11 else na;
plot zero_22 = if lines then zero11 else na;
plot posOne_22 = if lines then one11 else na;
plot two_22 = if lines then two11 else na;
plot three_22 = if lines then three11 else na;
negThree_22.AssignValueColor(if negThree then Color.RED else Color.DARK_RED);
negTwo_22.AssignValueColor(if negTwo then Color.YELLOW else CreateColor(78,78,0));
negOne_22.AssignValueColor(if negOne then Color.GREEN else Color.DARK_GREEN);
zero_22.AssignValueColor(if zero then Color.GREEN else Color.DARK_GREEN);
posOne_22.AssignValueColor(if posOne then Color.GREEN else Color.DARK_GREEN);
two_22.AssignValueColor(if posTwo then Color.YELLOW else CreateColor(78,78,0));
three_22.AssignValueColor(if posThree then Color.RED else Color.DARK_RED);
#--- Band
plot negThree22 = if band then negThree1 else na;
plot negTwo22 = if band then negTwo1 else na;
plot negOne22 = if band then negOne1 else na;
plot zero22 = if band then zero1 else na;
plot one22 = if band then posone1 else na;
plot two22 = if band then postwo1 else na;
plot three22 = if band then posthree1 else na;
negThree22.AssignValueColor(if negThree then Color.RED else Color.DARK_RED);
negTwo22.AssignValueColor(if negTwo then Color.YELLOW else CreateColor(78,78,0));
negOne22.AssignValueColor(if negOne then Color.GREEN else Color.DARK_GREEN);
zero22.AssignValueColor(if zero then Color.GREEN else Color.DARK_GREEN);
one22.AssignValueColor(if posOne then Color.GREEN else Color.DARK_GREEN);
two22.AssignValueColor(if posTwo then Color.YELLOW else CreateColor(78,78,0));
three22.AssignValueColor(if posThree then Color.RED else Color.DARK_RED);
#--
plot negThree_2 = if negThree then negThree22 else na;
plot negTwo_2 = if negTwo then negTwo22 else na;
plot negOne_2 = if negOne then negOne22 else na;
plot zero_2 = if zero then zero22 else na;
plot posOne_2 = if posOne then one22 else na;
plot posTwo_2 = if posTwo then two22 else na;
plot posThree_2 = if posThree then three22 else na;
negThree_2.SetDefaultColor(Color.RED);
negTwo_2.SetDefaultColor(Color.YELLOW);
negOne_2.SetDefaultColor(Color.GREEN);
zero_2.SetDefaultColor(Color.GREEN);
posone_2.SetDefaultColor(Color.GREEN);
postwo_2.SetDefaultColor(Color.YELLOW);
posthree_2.SetDefaultColor(Color.RED);
negThree_2.SetLineWeight(2);
negTwo_2.SetLineWeight(2);
negOne_2.SetLineWeight(2);
zero_2.SetLineWeight(2);
posone_2.SetLineWeight(2);
postwo_2.SetLineWeight(2);
posthree_2.SetLineWeight(2);
def negThree33 = if last then na else negThree1;
def negTwo33 = if last then na else negTwo1;
def negOne33 = if last then na else negOne1;
def zero33 = if last then na else zero1;
def posOne33 = if last then na else posOne1;
def posTwo33 = if last then na else posTwo1;
def posThree33 = if last then na else posThree1;
def negThree3 = CompoundValue(1, if IsNaN(negThree33) then negThree3[1] else negThree1, negThree1);
def negTwo3 = CompoundValue(1, if IsNaN(negTwo33) then negTwo3[1] else negTwo1, negTwo1);
def negOne3 = CompoundValue(1, if IsNaN(negOne33) then negOne3[1] else negOne1, negOne1);
def zero3 = CompoundValue(1, if IsNaN(zero33) then zero3[1] else zero1, zero1);
def posOne3 = CompoundValue(1, if IsNaN(posOne33) then posOne3[1] else posOne1, posOne1);
def posTwo3 = CompoundValue(1, if IsNaN(posTwo33) then posTwo3[1] else posTwo1, posTwo1);
def posThree3 = CompoundValue(1, if IsNaN(posThree33) then posThree3[1] else posThree1, posThree1);
plot negThree_3 = if !last or last[n] then na else negThree3;
plot negTwo_3 = if !last or last[n] then na else negTwo3;
plot negOne_3 = if !last or last[n] then na else negOne3;
plot zero_3 = if !last or last[n] then na else zero3;
plot posOne_3 = if !last or last[n] then na else posOne3;
plot posTwo_3 = if !last or last[n] then na else posTwo3;
plot posThree_3 = if !last or last[n] then na else posThree3;
negThree_3.AssignValueColor(if negThree[n] then Color.RED else Color.GRAY);
negTwo_3.AssignValueColor(if negTwo[n] then Color.YELLOW else Color.GRAY);
negOne_3.AssignValueColor(if negOne[n] then Color.GREEN else Color.GRAY);
zero_3.AssignValueColor(if zero[n] then Color.GREEN else Color.GRAY);
posone_3.AssignValueColor(if posone[n] then Color.GREEN else Color.GRAY);
postwo_3.AssignValueColor(if postwo[n] then Color.YELLOW else Color.GRAY);
posthree_3.AssignValueColor(if posthree[n] then Color.RED else Color.GRAY);
negThree_3.SetHiding(!propLines);
negTwo_3.SetHiding(!propLines);
negOne_3.SetHiding(!propLines);
zero_3.SetHiding(!propLines);
posone_3.SetHiding(!propLines);
postwo_3.SetHiding(!propLines);
posthree_3.SetHiding(!propLines);
#-- Label
Addlabel(showLabel, "(0.13%) $" + Round(negThree1,2), if negThree then Color.RED else Color.DARK_RED);
Addlabel(showLabel, "(2.28%) $" + Round(negTwo1,2), if negTwo then Color.YELLOW else CreateColor(78,78,0));
Addlabel(showLabel, "(16.0%) $" + Round(negOne1,2), if negOne then Color.GREEN else Color.DARK_GREEN);
Addlabel(showLabel, "(50.0%) $" + Round(zero1,2), if zero then Color.GREEN else Color.DARK_GREEN);
Addlabel(showLabel, "(85.0%) $" + Round(posOne1,2), if posOne then Color.GREEN else Color.DARK_GREEN);
Addlabel(showLabel, "(98.0%) $" + Round(posTwo1,2), if posTwo then Color.YELLOW else CreateColor(78,78,0));
Addlabel(showLabel, "(99.9%) $" + Round(posThree1,2), if posThree then Color.RED else Color.DARK_RED);
# -- Bubbles
AddChartBubble(negThree_3 and negThree_3[n-1] and propBubbles, negThree_3 ,round(negThree1[n],2),
if negThree[n] then Color.RED else Color.GRAY, yes);
AddChartBubble(negTwo_3 and negTwo_3[n-1] and propBubbles, negTwo_3 ,round(negTwo1[n],2),
if negTwo[n] then Color.YELLOW else Color.GRAY, yes);
AddChartBubble(negOne_3 and negOne_3[n-1] and propBubbles, negOne_3 ,round(negOne1[n],2),
if negOne[n] then Color.GREEN else color.GRAY, yes);
AddChartBubble(zero_3 and zero_3[n-1] and propBubbles, zero_3 ,round(zero1[n],2),
if zero[n] then Color.GREEN else Color.GRAY, yes);
AddChartBubble(posOne_3 and posOne_3[n-1] and propBubbles, posOne_3 ,round(posOne1[n],2),
if posOne[n] then Color.GREEN else Color.GRAY, yes);
AddChartBubble(posTwo_3 and posTwo_3[n-1] and propBubbles, posTwo_3 ,round(posTwo1[n],2),
if posTwo[n] then Color.YELLOW else Color.GRAY, yes);
AddChartBubble(posThree_3 and posThree_3[n-1] and propBubbles, posThree_3 ,round(posThree1[n],2),
if posThree[n] then Color.RED else Color.GRAY, yes);
#-- Clouds
#HighlightLevels
AddCloud(if !HighlightLevels then na else three22, two22, Color.DARK_RED);
AddCloud(if !HighlightLevels then na else two22, one22, CreateColor(78,78,0));
AddCloud(if !HighlightLevels then na else one22, negOne22, Color.DARK_GRAY);
AddCloud(if !HighlightLevels then na else negOne22, negTwo22, CreateColor(78,78,0));
AddCloud(if !HighlightLevels then na else negTwo22, negThree22, Color.DARK_RED);
AddCloud(if !HighlightLevels then na else three_22, two_22, Color.DARK_RED);
AddCloud(if !HighlightLevels then na else two_22, posOne_22, CreateColor(78,78,0));
AddCloud(if !HighlightLevels then na else posOne_22, negOne_22, Color.DARK_GRAY);
AddCloud(if !HighlightLevels then na else negOne_22, negTwo_22, CreateColor(78,78,0));
AddCloud(if !HighlightLevels then na else negTwo_22, negThree_22, Color.DARK_RED);
#-- Signals
def zRising = z >= highest(average(z, 5), 5);
def zFalling = z <= lowest(average(z, 5), 5);
def sigUp = (source crosses above zsma) and zRising and z>0.5;
def sigDn = (source crosses below zsma) and zFalling and z<-0.5;
AddChartBubble(ShowSignals and sigUp, low, "Buy", Color.GREEN, no);
AddChartBubble(ShowSignals and sigDn, high, "Sell", Color.RED, yes);
#END of CODE