The following thinkScript of the true momentum oscillator was created by Mobius.
For high-speed execution, the standard input lengths (Length 14, Calc 5, Smooth 3) are perfectly optimized out-of-the-box for the 5-minute intraday chart. If you are running an ultra-aggressive 1-minute execution chart, reducing the input length to 7 or 10 allows the momentum clouds to track fast, real-time momentum loops without compromising structural accuracy.
The core trigger is an internal polarity shift. A mechanical buy entry occurs at the exact moment the green Main line crosses above the red Signal line. A sell or short signal triggers when the Main line crosses below the Signal line. Because the indicator plots locked points, traders can rely on these crossovers as fixed execution markers that will never vanish or shift lines later in the trading session.
To protect your downside, do not execute random crossovers in the dead center of the indicator. High-probability setups form exclusively when a crossover occurs outside the overbought (+10) or oversold (-10) parameter clouds. Trading reversals at the extreme polarities ensures you are entering a trade at the maximum point of trend exhaustion, significantly tightening your stop-loss placement right below the structural swing high or low.
To filter out these fakeouts and avoid burning capital, never trade a TMO crossover if the lines are flatlining directly along the zero baseline. Wait for the oscillator to clearly pull away into the outer extreme clouds before executing an entry.
For the ultimate confirmation, overlay a higher-aggregation time frame
https://usethinkscript.com/threads/tmo-with-higher-agg_mobius-tsl.91/
(e.g., viewing a 5-minute TMO line while trading a 1-minute execution chart) to verify that your micro-entry aligns perfectly with the macro-institutional flow.
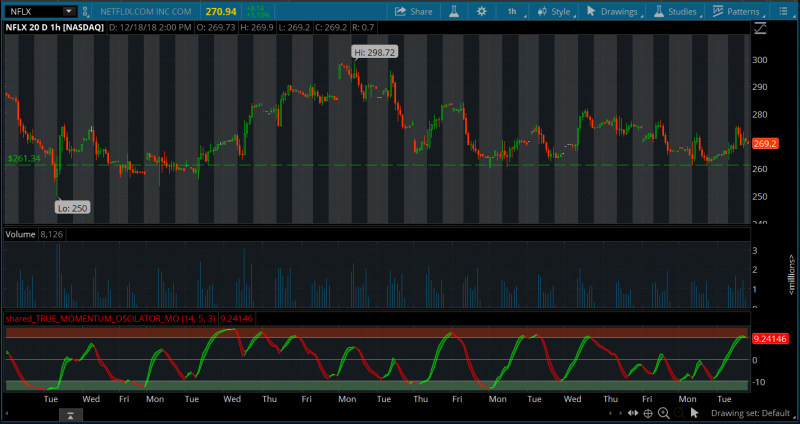
It calculates momentum using the delta of price. Price delta gauges the change rate, providing a dynamic view of direction and intensity. Giving a much better picture of trend, tend reversals and divergence than momentum oscillators using price.
Best Indicator Settings for Intraday and Day Trading
The True Momentum Oscillator (TMO) calculates momentum using the direct delta (rate of change) of price, rather than raw price variance. This structural shift strips out the chaotic intraday market noise that causes traditional oscillators like the RSI or Stochastic to get stuck pinned in overbought or oversold zones.For high-speed execution, the standard input lengths (Length 14, Calc 5, Smooth 3) are perfectly optimized out-of-the-box for the 5-minute intraday chart. If you are running an ultra-aggressive 1-minute execution chart, reducing the input length to 7 or 10 allows the momentum clouds to track fast, real-time momentum loops without compromising structural accuracy.
No-Repaint Signal Execution and Entry Rules
Unlike standard visual trend trackers that recalculate and alter their past plots, the TMO is a strict, non-repainting indicator. Once a candle closes and the TMO Main and Signal lines cross, that data point is locked permanently into your ThinkOrSwim cache.The core trigger is an internal polarity shift. A mechanical buy entry occurs at the exact moment the green Main line crosses above the red Signal line. A sell or short signal triggers when the Main line crosses below the Signal line. Because the indicator plots locked points, traders can rely on these crossovers as fixed execution markers that will never vanish or shift lines later in the trading session.
Win Rate Reality and Strategy Backtest Expectations
Mainstream influencers frequently promise a 90% win rate using standard indicators, which is a mathematical impossibility under real-time risk parameters. The TMO brings transparency back to day trading. It performs at its highest efficiency when used to identify deep cycle exhaustion and massive divergence setups.To protect your downside, do not execute random crossovers in the dead center of the indicator. High-probability setups form exclusively when a crossover occurs outside the overbought (+10) or oversold (-10) parameter clouds. Trading reversals at the extreme polarities ensures you are entering a trade at the maximum point of trend exhaustion, significantly tightening your stop-loss placement right below the structural swing high or low.
Avoiding False Breakouts and Trap Scenarios
While the TMO is one of the most reliable momentum tools on the forum, it has one definitive trap scenario: low-volume, sideways consolidation. When a stock is grinding horizontally inside a tight, chop range, the TMO lines will repeatedly compress and flash false crossover triggers.To filter out these fakeouts and avoid burning capital, never trade a TMO crossover if the lines are flatlining directly along the zero baseline. Wait for the oscillator to clearly pull away into the outer extreme clouds before executing an entry.
For the ultimate confirmation, overlay a higher-aggregation time frame
https://usethinkscript.com/threads/tmo-with-higher-agg_mobius-tsl.91/
(e.g., viewing a 5-minute TMO line while trading a 1-minute execution chart) to verify that your micro-entry aligns perfectly with the macro-institutional flow.
Posts prior to 2021 have been archived:
https://usethinkscript.com/threads/tmo-true-momentum-oscillator-archived-posts.15/
thinkScript Code
Rich (BB code):
# TMO ((T)rue (M)omentum (O)scilator)
# Mobius
# V01.05.2018
# hint: TMO calculates momentum using the delta of price. Giving a much better picture of trend, tend reversals and divergence than momentum oscillators using price.

declare Lower;

input length = 14;
input calcLength = 5;
input smoothLength = 3;

def o = open;
def c = close;
def data = fold i = 0 to length
           with s
           do s + (if c > getValue(o, i)
                   then 1
                   else if c < getValue(o, i)
                        then - 1
                        else 0);
def EMA5 = ExpAverage(data, calcLength);
plot Main = ExpAverage(EMA5, smoothLength);
plot Signal = ExpAverage(Main, smoothLength);
     Main.AssignValueColor(if Main > Signal
                           then color.green
                           else color.red);
     Signal.AssignValueColor(if Main > Signal
                             then color.green
                             else color.red);
     Signal.HideBubble();
     Signal.HideTitle();
addCloud(Main, Signal, color.green, color.red);
plot zero = if isNaN(c) then double.nan else 0;
     zero.SetDefaultColor(Color.gray);
     zero.hideBubble();
     zero.hideTitle();
plot ob = if isNaN(c) then double.nan else round(length * .7);
     ob.SetDefaultColor(Color.gray);
     ob.HideBubble();
     ob.HideTitle();
plot os = if isNaN(c) then double.nan else -round(length * .7);
     os.SetDefaultColor(Color.gray);
     os.HideBubble();
     os.HideTitle();
addCloud(ob, length, color.light_red, color.light_red, no);
addCloud(-length, os, color.light_green, color.light_green);
# End Code TMO
Shareable Link
https://tos.mx/yXqNwi
Last edited by a moderator: