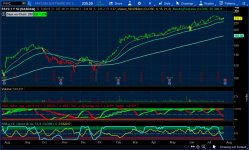
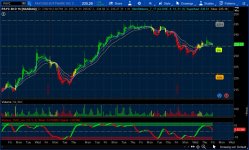
TMO True Momentum Oscillator For ThinkOrSwim

BenTen

Administrative
Staff member
Staff
VIP
Lifetime
The following thinkScript of the true momentum oscillator was created by Mobius.
It calculates momentum using the delta of price. Price delta gauges the change rate, providing a dynamic view of direction and intensity. Giving a much better picture of trend, tend reversals and divergence than momentum oscillators using price.

Best Indicator Settings for Intraday and Day Trading​

The True Momentum Oscillator (TMO) calculates momentum using the direct delta (rate of change) of price, rather than raw price variance. This structural shift strips out the chaotic intraday market noise that causes traditional oscillators like the RSI or Stochastic to get stuck pinned in overbought or oversold zones.

For high-speed execution, the standard input lengths (Length 14, Calc 5, Smooth 3) are perfectly optimized out-of-the-box for the 5-minute intraday chart. If you are running an ultra-aggressive 1-minute execution chart, reducing the input length to 7 or 10 allows the momentum clouds to track fast, real-time momentum loops without compromising structural accuracy.

No-Repaint Signal Execution and Entry Rules​

Unlike standard visual trend trackers that recalculate and alter their past plots, the TMO is a strict, non-repainting indicator. Once a candle closes and the TMO Main and Signal lines cross, that data point is locked permanently into your ThinkOrSwim cache.

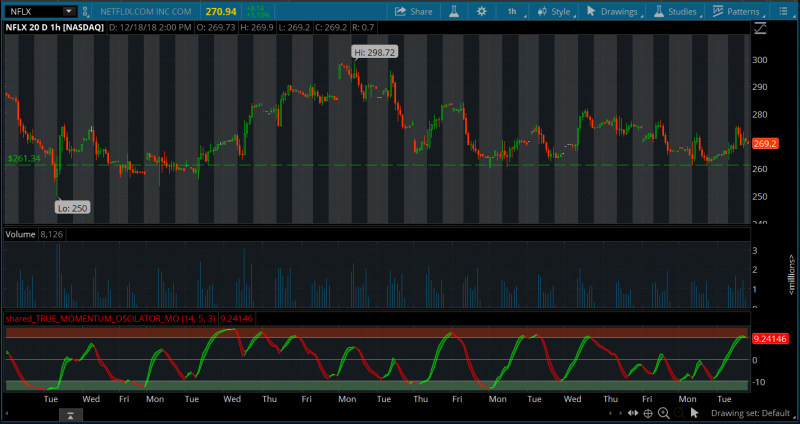
The core trigger is an internal polarity shift. A mechanical buy entry occurs at the exact moment the green Main line crosses above the red Signal line. A sell or short signal triggers when the Main line crosses below the Signal line. Because the indicator plots locked points, traders can rely on these crossovers as fixed execution markers that will never vanish or shift lines later in the trading session.

Win Rate Reality and Strategy Backtest Expectations​

Mainstream influencers frequently promise a 90% win rate using standard indicators, which is a mathematical impossibility under real-time risk parameters. The TMO brings transparency back to day trading. It performs at its highest efficiency when used to identify deep cycle exhaustion and massive divergence setups.

To protect your downside, do not execute random crossovers in the dead center of the indicator. High-probability setups form exclusively when a crossover occurs outside the overbought (+10) or oversold (-10) parameter clouds. Trading reversals at the extreme polarities ensures you are entering a trade at the maximum point of trend exhaustion, significantly tightening your stop-loss placement right below the structural swing high or low.

Avoiding False Breakouts and Trap Scenarios​

While the TMO is one of the most reliable momentum tools on the forum, it has one definitive trap scenario: low-volume, sideways consolidation. When a stock is grinding horizontally inside a tight, chop range, the TMO lines will repeatedly compress and flash false crossover triggers.

To filter out these fakeouts and avoid burning capital, never trade a TMO crossover if the lines are flatlining directly along the zero baseline. Wait for the oscillator to clearly pull away into the outer extreme clouds before executing an entry.

For the ultimate confirmation, overlay a higher-aggregation time frame
https://usethinkscript.com/threads/tmo-with-higher-agg_mobius-tsl.91/
(e.g., viewing a 5-minute TMO line while trading a 1-minute execution chart) to verify that your micro-entry aligns perfectly with the macro-institutional flow.
L5Oru8N.png

thinkScript Code

Rich (BB code):
# TMO ((T)rue (M)omentum (O)scilator)
# Mobius
# V01.05.2018
# hint: TMO calculates momentum using the delta of price. Giving a much better picture of trend, tend reversals and divergence than momentum oscillators using price.

declare Lower;

input length = 14;
input calcLength = 5;
input smoothLength = 3;

def o = open;
def c = close;
def data = fold i = 0 to length
           with s
           do s + (if c > getValue(o, i)
                   then 1
                   else if c < getValue(o, i)
                        then - 1
                        else 0);
def EMA5 = ExpAverage(data, calcLength);
plot Main = ExpAverage(EMA5, smoothLength);
plot Signal = ExpAverage(Main, smoothLength);
     Main.AssignValueColor(if Main > Signal
                           then color.green
                           else color.red);
     Signal.AssignValueColor(if Main > Signal
                             then color.green
                             else color.red);
     Signal.HideBubble();
     Signal.HideTitle();
addCloud(Main, Signal, color.green, color.red);
plot zero = if isNaN(c) then double.nan else 0;
     zero.SetDefaultColor(Color.gray);
     zero.hideBubble();
     zero.hideTitle();
plot ob = if isNaN(c) then double.nan else round(length * .7);
     ob.SetDefaultColor(Color.gray);
     ob.HideBubble();
     ob.HideTitle();
plot os = if isNaN(c) then double.nan else -round(length * .7);
     os.SetDefaultColor(Color.gray);
     os.HideBubble();
     os.HideTitle();
addCloud(ob, length, color.light_red, color.light_red, no);
addCloud(-length, os, color.light_green, color.light_green);
# End Code TMO

Shareable Link

https://tos.mx/yXqNwi
 
Last edited by a moderator:
This one runs under my RSI Laguerre on a daily chart. Mobius recently put it on his trading chart. Turn off after and before market hours. Delta of price is really only calculated during RTH. Unless you're trading futures, then if there's option trading, there's Delta of Price, as I understand it.
*It is traded at the polarity change signal, not the zero line. I love this indicator.

#07:10 Mobius: Had the opportunity to do some reading over the weekend and found an interesting paper on an old subject, Momentum. The author suggested the purest way to measure momentum was by using delta of price rather than variance in price in order to eliminate the inherent volatility in price. This indicator does that.

Mobius TMO WatchList Column Code. Plots 1 and green if main is above signal and 0 and red otherwise.

Code:
input length = 14;
input calcLength = 5;
input smoothLength = 3;

def o = open;
def c = close;
def data = fold i = 0 to length
           with s
           do s + (if c > getValue(o, i)
                   then 1
                   else if c < getValue(o, i)
                        then - 1
                        else 0);
def EMA5 = ExpAverage(data, calcLength);
def Main = ExpAverage(EMA5, smoothLength);
def Signal = ExpAverage(Main, smoothLength);
plot isTrue = if Main > Signal then 1 else 0;
AssignBackgroundColor(if Main > Signal
                           then color.green
                           else color.red);
 
Last edited:

TMO w Higher Agg as Shown in Daily Chart

08:43 Mobius: Well, give it a few days to get altered, munched, distorted and twisted. Then when it gets back to being used as intended someone will start making money with it.
08:45 Mobius: Oh and in my view - It's highest and best use is as designed with a secondary aggregation plotted either on it or with it around 5 to 10 times higher.
https://tos.mx/bc1Hwy
Code:
#TMO True Momentum Oscillator with Higher Aggregation _Mobius
#Tuesday, May 15, 2018 12:36 PM
## OneNote Archive Name: TMO True Momentum Oscillator with Higher Aggregation _Mobius
## Archive Section: Momentum
## Suggested Tos Name: TrueMomentumOscillator_w_HigherAggregation_Mobius
## Archive Date: 5.15.2018
## Archive Notes:
## 08:43 Mobius: Well give it a few days to get altered, munched, distorted and twisted. Then when it get back to being used as intended someone will start making money with it.
## 08:45 Mobius: Oh and in my view - It's highest and best use is as designed with a secondary aggregation plotted either on it or with it around 5 to 10 time higher.
## "##" indicates an addition or adjustment by the OneNote Archivist
## Original Code Follows
# TMO ((T)rue (M)omentum (O)scillator) With Higher Aggregation
# Mobius
# V01.05.2018
#hint: TMO calculates momentum using the delta of price. Giving a much better picture of trend, tend reversals and divergence than momentum oscillators using price.

declare Lower;

input length = 14;
input calcLength = 5;
input smoothLength = 3;
input agg = AggregationPeriod.weeK;

def o = open(period = agg);
def c = close(period = agg);
def data = fold i = 0 to length
           with s
           do s + (if c > getValue(o, i)
                   then 1
                   else if c < getValue(o, i)
                        then - 1
                        else 0);
def EMA5 = ExpAverage(data, calcLength);
plot Main = ExpAverage(EMA5, smoothLength);
plot Signal = ExpAverage(Main, smoothLength);
     Main.AssignValueColor(if Main > Signal
                           then color.green
                           else color.Red);
     Signal.AssignValueColor(if Main > Signal
                             then color.green
                             else color.red);
     Signal.HideBubble();
     Signal.HideTitle();
addCloud(Main, Signal, Color.LIGHT_GREEN, color.red);
plot zero = if isNaN(c) then double.nan else 0;
     zero.SetDefaultColor(Color.gray);
     zero.hideBubble();
     zero.hideTitle();
plot ob = if isNaN(c) then double.nan else round(length * .8);
     ob.SetDefaultColor(Color.gray);
     ob.HideBubble();
     ob.HideTitle();
plot os = if isNaN(c) then double.nan else -round(length * .8);
     os.SetDefaultColor(Color.gray);
     os.HideBubble();
     os.HideTitle();
addCloud(ob, length, Color.GREEN, Color.GREEN, Yes);
addCloud(-length, os, Color.LIGHT_RED, Color.LIGHT_RED, showBorder = Yes);
# End Code TMO with Higher Aggregation
 
Last edited:
Is there a way to set up a scan for when the indicator is below -10 and changes in color from red to green?
TIA
 
Is there a way to set up a scan for when the indicator is below -10 and changes in color from red to green?
TIA

@tenacity11 Per your request, I have modified Mobius TMO to scan for stocks when it is below -10 and the cloud has transitioned from red to green. Scanning this against the S&P 500 I obtained 1 result and on the NASDAQ Composite I obtained 43 results, using daily aggregation.

At this point I don't expect too many results as the major indices have been making new highs and most stocks are not selling off. Wait to see a correlated market so when stocks do sell off you should see a lot more results

Code:
# TMO ((T)rue (M)omentum (O)scilator) Scan
# Mobius, with modifications by tomsk, 1.1.2020
# V01.05.2018
#hint: TMO calculates momentum using the delta of price. Giving a much better picture of trend, tend reversals and divergence than momentum

oscillators using price.

input length = 14;
input calcLength = 5;
input smoothLength = 3;
input level = -10;

def o = open;
def c = close;
def data = fold i = 0 to length
           with s
           do s + (if c > getValue(o, i)
                   then 1
                   else if c < getValue(o, i)
                        then - 1
                        else 0);
def EMA5 = ExpAverage(data, calcLength);
def Main = ExpAverage(EMA5, smoothLength);
def Signal = ExpAverage(Main, smoothLength);

plot scan = main < level and signal < level and main > signal;
# End TMO ((T)rue (M)omentum (O)scilator) Scan
 
@markos My assumption is that your request is for a polarity change (red to green) with a TMO reading of < -10. If that is the case just replace the last line of my previous post with the following line of code. There were no results on a daily scan of the S&P 500, but I managed to get 13 results on the NASDAQ Composite

Code:
plot scan = main < level and signal < level and sum(main > signal, 3) >= 3;
 
Last edited:
I like the 3 min timeframe. I like trading futures.
I created an upper indicator that shows a dot on the candles that are over and under 5. This shows me times when I should look for a reversal. if the price doesn't reverse past that candle, then price should continue towards the trend. Below is the UPPER indicator.

# TMO ((T)rue (M)omentum (O)scilator)
# Mobius
# V01.05.2018
#hint: TMO calculates momentum using the delta of price. Giving a much better picture of trend, tend reversals and divergence than momentum oscillators using price.


input length = 6;
input calcLength = 3;
input smoothLength = 2;

def o = open;
def c = close;
def data = fold i = 0 to length
with s
do s + (if c > GetValue(o, i)
then 1
else if c < GetValue(o, i)
then - 1
else 0);
def EMA5 = ExpAverage(data, calcLength);
DEF Main = ExpAverage(EMA5, smoothLength);
#plot Signal = ExpAverage(Main, smoothLength);

#plot zero = if isNaN(c) then double.nan else 0;

#plot ob = if isNaN(c) then double.nan else round(length * .8);

#plot os = if isNaN(c) then double.nan else -round(length * .8);

plot sell = if main is greater than 5 then 1 else 0;
plot buy = if main is less than -5 then 1 else 0;

BUY.SetPaintingStrategy(PaintingStrategy.BOOLEAN_POINTS);
BUY.SetDefaultColor(Color.CYAN);
SELL.SetPaintingStrategy(PaintingStrategy.BOOLEAN_POINTS);
SELL.SetDefaultColor(Color.CYAN);
BUY.SetLineWeight(5);
SELL.SetLineWeight(5);
 
@switchfire Here is a simple crossover buy/sell strategy for you to backtest. You can also take this same concept and apply it to other indicators.

Code:
# TMO ((T)rue (M)omentum (O)scilator)
# Mobius
# V01.05.2018
# hint: TMO calculates momentum using the delta of price. Giving a much better picture of trend, tend reversals and divergence than momentum oscillators using price.
# 01/27/2020 Backtesting code added by BenTen

input length = 14;
input calcLength = 5;
input smoothLength = 3;

def o = open;
def c = close;
def data = fold i = 0 to length


           with s
           do s + (if c > getValue(o, i)


                   then 1
                   else if c<getValue(o, i)


                        then - 1
                        else 0);
def EMA5 = ExpAverage(data, calcLength);
plot Main = ExpAverage(EMA5, smoothLength);
plot Signal = ExpAverage(Main, smoothLength);
Main.AssignValueColor(if Main > Signal
                      then color.green
                           else color.red);
     Signal.AssignValueColor(if Main > Signal
                             then color.green
                             else color.red);
     Signal.HideBubble();
     Signal.HideTitle();
addCloud(Main, Signal, color.green, color.red);
plot zero = if isNaN(c) then double.nan else 0;
     zero.SetDefaultColor(Color.gray);
     zero.hideBubble();
     zero.hideTitle();
plot ob = if isNaN(c) then double.nan else round(length* .7);
ob.SetDefaultColor(Color.gray);
     ob.HideBubble();
     ob.HideTitle();
plot os = if isNaN(c) then double.nan else -round(length* .7);
os.SetDefaultColor(Color.gray);
     os.HideBubble();
     os.HideTitle();
addCloud(ob, length, color.light_red, color.light_red, no);
addCloud(-length, os, color.light_green, color.light_green);
# End Code TMO

# Backtesting Code
def buy = Main crosses above Signal;
def sell = Main crosses below Signal;

AddOrder(OrderType.BUY_AUTO, condition = buy, price = close,100, tickcolor = Color.GREEN, arrowcolor = Color.GREEN, name = "BUY");
AddOrder(OrderType.SELL_AUTO, condition = sell, price = close,100, tickcolor = Color.RED, arrowcolor = Color.RED, name = "SELL");
 
This plots a rounded value to give you a better idea of where in the cycle the signal line is.
Code:
# TMO ((T)rue (M)omentum (O)scilator)
# Mobius
# V01.05.2018
#hint: TMO calculates momentum using the delta of price. Giving a much better picture of trend, tend reversals and divergence than momentum oscillators using price.

declare Lower;

input length = 21;
input calcLength = 5;
input smoothLength = 3;

def o = open;
def c = close;
def data = fold i = 0 to length
           with s
           do s + (if c > getValue(o, i)
                   then 1
                   else if c < getValue(o, i)
                        then - 1
                        else 0);
def EMA5 = ExpAverage(data, calcLength);
def Main = ExpAverage(EMA5, smoothLength);
def Signal = ExpAverage(Main, smoothLength);
assignBackgroundColor(if Main > Signal
                           then color.dark_green
                           else color.Dark_red);
 

def ob = if isNaN(c) then double.nan else round(length * .7);

def os = if isNaN(c) then double.nan else -round(length * .7);

plot IntheGreen = (Signal < os);
AddLabel(IntheGreen, "OS", Color.White);
plot IntheRed = (Signal > ob);
AddLabel(IntheRed, "OB", Color.White);
plot IntheMIddle = (Signal < ob and Signal > OS);
AddLabel(IntheMIddle,  Round(Signal, 0), Color.White);
 
Does anyone have the scanner script for this TMO?
@stocksniper try this out. Read carefully as there are two bear and two bull scans included and you have to comment out (#) the right lines.
Code:
# TMO ((T)rue (M)omentum (O)scilator) Scan
# Mobius, with modifications by tomsk, 1.1.2020
# V01.05.2018
#hint: TMO calculates momentum using the delta of price. Giving a much better picture of trend, tend reversals and divergence than momentum oscillators using price.

input length = 14;
input calcLength = 5;
input smoothLength = 3;
#input level = -10;   ##Bullish Scan
#input level = 10;   ##Bearish Scan

def o = open;
def c = close;
def data = fold i = 0 to length
           with s
           do s + (if c > getValue(o, i)
                   then 1
                   else if c < getValue(o, i)
                        then - 1
                        else 0);
def EMA5 = ExpAverage(data, calcLength);
def Main = ExpAverage(EMA5, smoothLength);
def Signal = ExpAverage(Main, smoothLength);

#hint: Comment out using # below to scan for Bullish or Bearish.  Please note that ## applies to conditional scan with parameters -10 (over sold condition) Bullish Scan) and 10 (over bought condition) Bearish Scan) Default is set to a Bullish TMO Scan without any conditions.

##***Bullish Scan***

##plot scan = main < level and signal < level and main > signal;
#plot scan = main < main[1] and signal < signal[1];

##***Bearish Scan***

##plot scan = main > level and signal > level and main < signal;
plot scan = main > main[1] and signal > signal[1];
 
Short and Buy Bubble Signals for momentum

Code:
declare lower;

input length = 7;
input calcLength = 5;
input smoothLength = 3;

def o = open;
def c = close;
def data = fold i = 0 to length
           with s
           do s + (if c > GetValue(o, i)
                   then 1
                   else if c < GetValue(o, i)
                        then - 1
                        else 0);
def EMA5 = ExpAverage(data, calcLength);
plot Main = ExpAverage(EMA5, smoothLength);
plot Signal = ExpAverage(Main, smoothLength);
Main.AssignValueColor(if Main > Signal then Color.GREEN else Color.GREEN);
Signal.AssignValueColor(if Main > Signal then Color.RED else Color.RED);
Signal.HideBubble();
Signal.HideTitle();
AddCloud(Main, Signal, Color.GREEN, Color.BLACK);
plot zero = if IsNaN(c) then Double.NaN else 0;
zero.SetDefaultColor(Color.WHITE);
zero.HideBubble();
zero.HideTitle();
plot ob = if IsNaN(c) then Double.NaN else Round(length * .7);
ob.SetDefaultColor(Color.BLUE);
ob.HideBubble();
ob.HideTitle();
plot os = if IsNaN(c) then Double.NaN else -Round(length * .7);
os.SetDefaultColor(Color.BLUE);
os.HideBubble();
os.HideTitle();

#BUBBLE
def CrossBar = if Main crosses Signal then BarNumber() else Double.NaN;


#CLOUD__________________________________________________________________________________________________________________
AddCloud(ob, length, Color.gray, Color.gray, no);
AddCloud(-length, os, Color.gray, Color.gray);

#DOTSandBUBBLES______________________________________________________________________________________________________________________
plot DownSignal = if Main crosses below Signal then Signal else Double.NaN;
DownSignal.SetPaintingStrategy(PaintingStrategy.Arrow_DOWN);
AddChartBubble((DownSignal) and (DownSignal), DownSignal, "S" , Color.RED);

plot UpSignal = if Main crosses above Signal then Signal else Double.NaN;
UpSignal.SetPaintingStrategy(PaintingStrategy.Arrow_Up);
AddChartBubble((UpSignal) and (UpSignal), UpSignal, "B" , Color.GREEN);

AddLabel (yes, if Main > Signal then "(2) MOMENTUM: BUY" + "" else "", Color.GREEN);
AddLabel (yes, if Main < Signal then "(2) MOMENTUM: SELL" + "" else "", Color.RED);
 
TMO WatchList
IEf8RM8.png

Ruby:
# ########################################################
# TMO ((T)rue (M)omentum (O)scilator) WatchList Column Only
# Mobius, with modifications by tomsk, 1.1.2020
#with WatchList added by @MerryDay 12/2020
#hint: TMO calculates momentum using the delta of price. Giving a much better picture of trend, tend reversals and divergence than momentum oscillators using price.
input showlabels = yes ;
input length = 14;
input calcLength = 5;
input smoothLength = 3;
input tmo_ob =  10;
input tmo_os = -10;

def data = fold i = 0 to length
           with s
           do s + (if close > getValue(open, i)
                   then 1
                   else if close < getValue(open, i)
                        then - 1
                        else 0);
def EMA5 = ExpAverage(data, calcLength);
def Main = ExpAverage(EMA5, smoothLength);
def Signal = ExpAverage(Main, smoothLength);
# ########################################################
#charting and formatting
plot TMO = round(main,0);
AssignBackgroundColor(
if main < tmo_os      then CreateColor(50, 200, 255) else
if main > tmo_ob      then CreateColor(255, 139 ,61) else
if main crosses above tmo_os then CreateColor(0, 0, 255) else
if main crosses below tmo_ob then CreateColor(255, 204, 0) else
if main < signal  then CreateColor(225, 0, 0) else
if main > main[1] then CreateColor(0, 165, 0) else CreateColor(204, 204, 204)) ;
Shared Link: http://tos.mx/6HaRN1a
 
Got the TMO (including MTF) working in EasyLanguage / Tradestation for anyone interested. To setup multiple time frames in TradeStation see this post: https://futures.io/easylanguage-pro...rame-programming-easylanguage.html#post154004

If you prefer not to have the MTF, just delete everything below {Data2}.
Code:
{TMO ((T)rue (M)omentum (O)scilator) - Universal Edition with Multiple Time Frames
originally created by Mobius, modified by hCaostrader, and ported to EasyLanguage with Multiple Time Frame capability added by TraderKevin
V12.8.2020
TMO calculates momentum using the delta of price. Giving a much better picture of trend, tend reversals and divergence than momentum oscillators using price.}

inputs: 
    Length( 14 ) [
        DisplayName = "Length",
        ToolTip = "Enter the number of bars to be used in the calculation of the TMO."],
    
    calcLength( 5 ) [
        DisplayName = "calcLength",
        ToolTip = "Enter the number of bars to be used in the calculation of the calcLength."],
        
    smoothLength( 3 ) [
        DisplayName = "smoothLength",
        ToolTip = "Enter the number of bars to be used in the calculation of the smoothLength."],
    Cloud(False) [
        DisplayName = "Cloud",
        ToolTip = "True to display cloud, false to disable."];

 variables: 
    x( 0, data1 ),
    normdata(0, data1),
    ema(0, data1),
    main(0, data1),
    signal(0, data1),
    ob(0, data1),
    os(0, data1),
    dat(0, data1),
    y(0, data1),
    intrabarpersist double uptrans(0),
    intrabarpersist double downtrans(0),
    intrabarpersist double span(0, data1),
    gap(0, data1),
    x2( 0, data2 ),
    normdata2(0, data2),
    ema2(0, data2),
    main2(0, data2),
    signal2(0, data2),
    dat2(0, data2),
    y2(0, data2),
    intrabarpersist double uptrans2(0),
    intrabarpersist double downtrans2(0),
    intrabarpersist double span2(0, data2),
    gap2(0, data2);;
    
{Data1}
dat = 0;
                
for x = 1 to Length Begin
if c > c[x] Then y = 1
            else if c < c[x] Then y = -1
                else y = 0;
    dat = dat + y ;
    end;
                
normdata = dat * 100 / length;
ema = XAverage(normdata, calcLength);
main = XAverage(ema, smoothLength);
signal = XAverage(main, smoothLength);
ob = 70;
os = -70;
uptrans = ARGB( 100, 0, 128, 0 );
downtrans = ARGB( 100, 255, 0, 0 );

plot1(main, "Main", iff(main > signal, Green, Red));
plot2(signal, "Signal", iff(main > signal, green, red));
plot3(0, "Zero", Lightgray);
plot4(ob, "OB", Darkred);
plot5(os, "OS", Darkgreen);

span = 0.5 * (main + signal);
gap = main - signal;

if cloud then
    plot6(span, "Cloud", iff(main > signal, uptrans, downtrans), default, iff(gap > 10, 13, 11));


{Data2}
dat2 = 0;

                
for x2 = 1 to Length Begin
if c of data2 > c[x2] of data2 Then y2 = 1
            else if c of data2 < c[x2] of data2 Then y2 = -1
                else y2 = 0;
    dat2 = dat2 + y2 ;
    end;
                
normdata2 = dat2 * 100 / length;
ema2 = XAverage(normdata2, calcLength);
main2 = XAverage(ema2, smoothLength);
signal2 = XAverage(main2, smoothLength);


plot7(main2, "Main2", iff(main2 > signal2, darkcyan, Darkmagenta));
plot8(signal2, "Signal2", iff(main2 > signal2, darkcyan, Darkmagenta));

span2 = 0.5 * (main2 + signal2);
gap2 = main2 - signal2;

if cloud then
    plot9(span2, "Cloud", iff(main2 > signal2, uptrans, downtrans), default, iff(gap2 > 10, 13, 11));
 
TMO Labels
Code:
Label color assignment:
Red    =Falling.. main < signal
Orange =Trend is maxing out.. main > overbought
Gray   =No trend, probable reversal..
Cyan   =Pre-trend.. main > signal and main < oversold
Green  =Trend is rising.. main > signal, main > oversold, main is rising, main < overbought
BLUE   =BEGINNING TO TREND.. main > signal and main is crossing above oversold
Yellow =END OF TREND.. main crossing below overbought
1JgJxy3.png

Below is a VISUAL Representative of the label colors:
This is NOT the TMO indicator, that can be found in the first post of this thread.
caZpBfh.png

Here is the shared label link: http://tos.mx/R4bTtS5
Code:
# TMO ((T)rue (M)omentum (O)oscillator) Labels and Candle Painting ONLY
# Mobius, with modifications by tomsk, 1.1.2020
#with Labels and Candle Painting added by @MerryDay 12/2020
#hint: TMO calculates momentum using the delta of price. Giving a much better picture of trend, tend reversals and divergence than momentum oscillators using price.

input showlabels = yes ;
input paintcandles = no ;
input length = 14;
input calcLength = 5;
input smoothLength = 3;
input ob =  10;
input os = -10;

def o = open;
def c = close;
def data = fold i = 0 to length
           with s
           do s + (if c > getValue(o, i)
                   then 1
                   else if c < getValue(o, i)
                        then - 1
                        else 0);
def EMA5 = ExpAverage(data, calcLength);
def Main = ExpAverage(EMA5, smoothLength);
def Signal = ExpAverage(Main, smoothLength);

DefineGlobalColor("pretrend", CreateColor(50, 200, 255)) ;
DefineGlobalColor("TrendBEGIN", CreateColor(0, 0, 255)) ;
DefineGlobalColor("rising",  CreateColor(0, 165, 0)) ;
DefineGlobalColor("maxxed", CreateColor(255, 139 ,61)) ;
DefineGlobalColor("TrendEnd", CreateColor(255, 204, 0)) ;
DefineGlobalColor("falling",  CreateColor(225, 0, 0)) ;
DefineGlobalColor("neutral", CreateColor(204, 204, 204)) ;
AddLabel(showlabels,
if main < os      then "TMO pre-trend " +round(main,0) else
if main > ob      then "TMO maxxed "  +round(main,0) else
if main crosses above os then "TMO TREND BEGIN!" else
if main crosses below ob then "TMO TREND END!" else
if main < signal  then "TMO Bear "    +round(main,0) else
if main >= main[1] then "TMO Rising " +round(main,0) else
if main < main[1] then "TMO Falling " +round(main,0) else
                       "TMO Neutral " +round(main,0),
if main < os      then GlobalColor("pretrend") else
if main > ob      then GlobalColor("maxxed") else
if main crosses above os then GlobalColor("TrendBEGIN") else
if main crosses below ob then GlobalColor("TrendEND") else
if main < signal  then GlobalColor("falling") else
if main > main[1] then GlobalColor("rising") else GlobalColor("neutral")) ;

AssignPriceColor(
if !paintcandles then color.CURRENT else
if main < os      then GlobalColor("pretrend") else
if main > ob      then GlobalColor("maxxed") else
if main crosses above os then GlobalColor("TrendBEGIN") else
if main crosses below ob then GlobalColor("TrendEND") else
if main < signal  then GlobalColor("falling") else
if main > main[1] then GlobalColor("rising") else GlobalColor("neutral")) ;
# End Code TMO
 
I updated the TMO LABELS. Go to post#360 for the updates.
Two critical conditions were missing:
  1. Crossing above oversold, signaling the beginning of a trend
  2. Crossing below overbought for the end of the trend.
The labels are Global Colors allowing easier color changes to accommodate different chart backgrounds.
9gMQw6Z.png
 
@unkownriver
TMO ((T)rue (M)omentum (O)scilator) Scan Scanner
Mobius, with modifications by tomsk, 1.1.2020

Ruby:
# TMO ((T)rue (M)omentum (O)scilator) Scan
# Mobius, with modifications by tomsk, 1.1.2020
# V01.05.2018
#hint: TMO calculates momentum using the delta of price. Giving a much better picture of trend, tend reversals and divergence than momentum oscillators using price.

input length = 14;
input calcLength = 5;
input smoothLength = 3;
input level = -15;   ##Bullish Scan
#input level = 10;   ##Bearish Scan

def o = open;
def c = close;
def data = fold i = 0 to length
           with s
           do s + (if c > getValue(o, i)
                   then 1
                   else if c < getValue(o, i)
                        then - 1
                        else 0);
def EMA5 = ExpAverage(data, calcLength);
plot Main = ExpAverage(EMA5, smoothLength);
def Signal = ExpAverage(Main, smoothLength);
addchartBubble(close,close,main);
plot sell = main crosses below 10 ;
#hint: Comment out using # below to scan for Bullish or Bearish.  Please note that ## applies to conditional scan with parameters -10 (over sold condition) Bullish Scan) and 10 (over bought condition) Bearish Scan) Default is set to a Bullish TMO Scan without any conditions.

##***Bullish Scan***
plot scan = main crosses above level;
#plot scan = main < level and signal < level and main > signal;
#plot scan = main < main[1] and signal < signal[1];

##***Bearish Scan***

##plot scan = main > level and signal > level and main < signal;
#plot scan = main > main[1] and signal > signal[1];
 
@MerryDay ,....you are terrific,...love the colors in the columns,......there happened to be a couple minor errors, here's my corrected code.

Code:
# TMO ((T)rue (M)omentum (O)scilator) Scan
# Mobius, with modifications by tomsk, 1.1.2020
# V01.05.2018
#hint: TMO calculates momentum using the delta of price. Giving a much better picture of trend, trend reversals and divergence than momentum oscillators using price.

input length = 14;
input calcLength = 5;
input smoothLength = 5;#3
input level = -5;   ##Bullish Scan
#input level = 10;   ##Bearish Scan

def o = open;
def c = close;
def data = fold i = 0 to length
           with s
           do s + (if c > getValue(o, i)
                   then 1
                   else if c < getValue(o, i)
                        then - 1
                        else 0);
def EMA5 = ExpAverage(data, calcLength);
def Main = ExpAverage(EMA5, smoothLength);
def Signal = ExpAverage(Main, smoothLength);
addchartBubble(close,close,main);
#plot sell = main crosses below 10 ;
#hint: Comment out using # below to scan for Bullish or Bearish.  Please note that ## applies to conditional scan with parameters -10 (over sold condition) Bullish Scan) and 10 (over bought condition) Bearish Scan) Default is set to a Bullish TMO Scan without any conditions.

##[B][I]Bullish Scan[/I][/B]
#plot scan = main crosses above level;
plot scan = main < level and signal < level and main > signal;
#plot scan = main < main[1] and signal < signal[1];

##[B][I]Bearish Scan[/I][/B]

#plot scan = main > level and signal > level and main < signal;
#plot scan = main > main[1] and signal > signal[1];
 
scanning through here looking for tmo script that adds arrows to chart for the main and signal crosses..anyone have it? yes I'm looking and will continue to look and yes I have tried to write it myself. thanks
 

Join useThinkScript to post your question to a community of 21,000+ developers and traders.

Similar threads

Not the exact question you're looking for?

Start a new thread and receive assistance from our community.

87k+ Posts
1519 Online
Create Post

Similar threads

Similar threads

The Market Trading Game Changer

Join 2,500+ subscribers inside the useThinkScript VIP Membership Club
  • Exclusive indicators
  • Proven strategies & setups
  • Private Discord community
  • ‘Buy The Dip’ signal alerts
  • Exclusive members-only content
  • Add-ons and resources
  • 1 full year of unlimited support

Frequently Asked Questions

What is useThinkScript?

useThinkScript is the #1 community of stock market investors using indicators and other tools to power their trading strategies. Traders of all skill levels use our forums to learn about scripting and indicators, help each other, and discover new ways to gain an edge in the markets.

How do I get started?

We get it. Our forum can be intimidating, if not overwhelming. With thousands of topics, tens of thousands of posts, our community has created an incredibly deep knowledge base for stock traders. No one can ever exhaust every resource provided on our site.

If you are new, or just looking for guidance, here are some helpful links to get you started.

What are the benefits of VIP Membership?
VIP members get exclusive access to these proven and tested premium indicators: Buy the Dip, Advanced Market Moves 2.0, Take Profit, and Volatility Trading Range. In addition, VIP members get access to over 50 VIP-only custom indicators, add-ons, and strategies, private VIP-only forums, private Discord channel to discuss trades and strategies in real-time, customer support, trade alerts, and much more. Learn all about VIP membership here.
How can I access the premium indicators?
To access the premium indicators, which are plug and play ready, sign up for VIP membership here.
Back
Top