In Ichimoku Cloud when Tenkan cross the Kijun upward/downward is called TK cross.
Trading can be performed based on the Cloud and TK cross for upward and downward direction. After the TK cross the trend is expected to continue for certain candle depending on the strength.
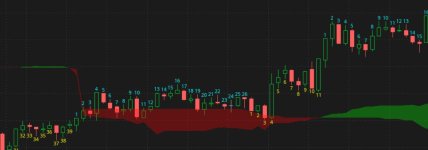
I am looking for a indicator that will give an up/down arrow when the TK cross then a number above the candle incrementing each candle as 1,2, 3..... then resets when the trend goes to another direction or new trend in the same direction arises. also, the script should ignore TK cross when the cross is inside the cloud.
here is the basic Ichimoku script for reference
Trading can be performed based on the Cloud and TK cross for upward and downward direction. After the TK cross the trend is expected to continue for certain candle depending on the strength.
I am looking for a indicator that will give an up/down arrow when the TK cross then a number above the candle incrementing each candle as 1,2, 3..... then resets when the trend goes to another direction or new trend in the same direction arises. also, the script should ignore TK cross when the cross is inside the cloud.
here is the basic Ichimoku script for reference
Ruby:
input tenkan_period = 9;
input kijun_period = 26;
def Tenkan = (Highest(high, tenkan_period) + Lowest(low, tenkan_period)) / 2;
def Kijun = (Highest(high, kijun_period) + Lowest(low, kijun_period)) / 2;
    def TKcross = Tenkan crosses Kijun ;

def SpanA = (Tenkan[kijun_period] + Kijun[kijun_period]) / 2;
def SpanB = (Highest(high[kijun_period], 2 * kijun_period) + Lowest(low[kijun_period], 2 * kijun_period)) / 2;
AddCloud(SpanA, SpanB, color.green, color.red);
Last edited by a moderator: